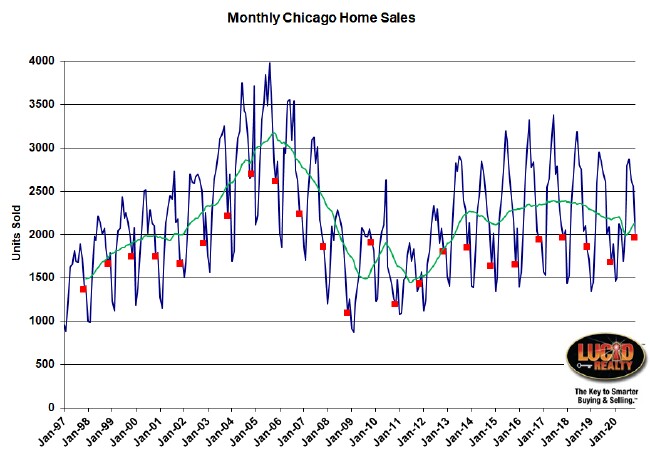
The Chicago real estate market is on a run. November was the third month in a row where home sales posted a 14 year record high. You can see it in the graph below which shows monthly home sales going back to 1997 with all Novembers flagged in red and a green 12 month moving average. However, the amount by which November sales exceeded previous years is not nearly as dramatic as it was in September or October so sales are losing a bit of steam.
November beat last year’s sales by 18.4%, which is still a very respectable showing. This surge is a last ditch attempt by the market to make up for the lost sales earlier in the year resulting from Covid 19 related issues. Please note that in a couple of weeks the Illinois Association of Realtors will release their official sales data and they will announce a 17.5% increase in home sales. We have agreed to disagree on the proper way to calculate sales gains.
Check out the moving average line and you’ll see that it’s coming back but is still not quite back to where it was before the pandemic struck but it’s getting really close to where it was a year ago. 12 month sales are now down only 1.6% from a year ago. It’s entirely possible that the year will close out with sales very close to 2019.
BTW, everything you’ve heard about how people are really liking the suburbs right now is absolutely true. The broader metro area, which includes the city and the suburbs, is doing even better than the city. Sales for the last 12 months are actually up 7.2% from last year at this time.
Chicago Home Contract Activity
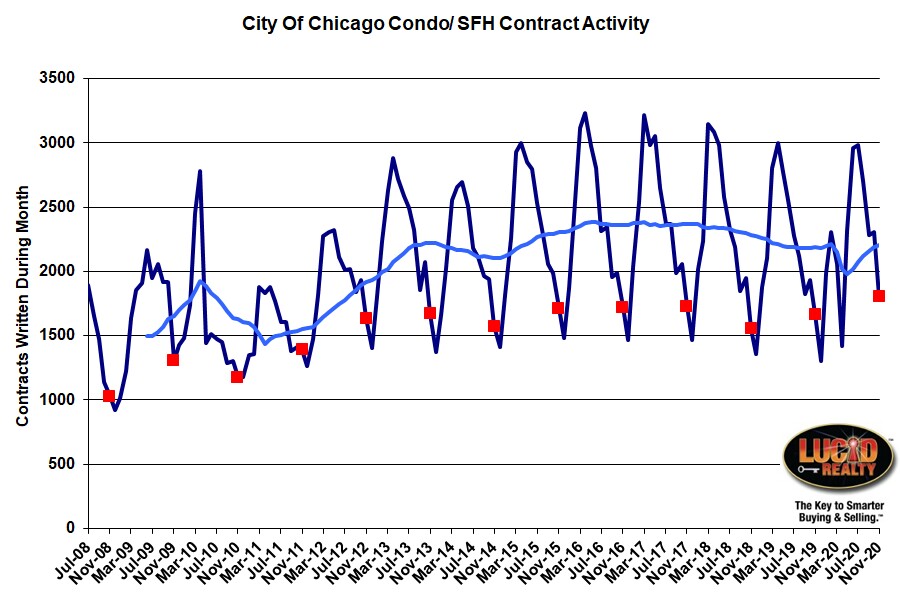
Contracts for homes continue to run at the highest levels since I’ve been tracking the data – 13 years now. November contracts were 8.3% higher than last year, which is the 5th month in a row of gains over last year, though the increases have been getting progressively smaller. If you look at the light blue moving average line below you’ll see that we’re just about back to where we were before the pandemic nightmare started.
The bottom line is that December closings should be higher than last year but you also have to factor in pending home sales.
Pending Home Sales
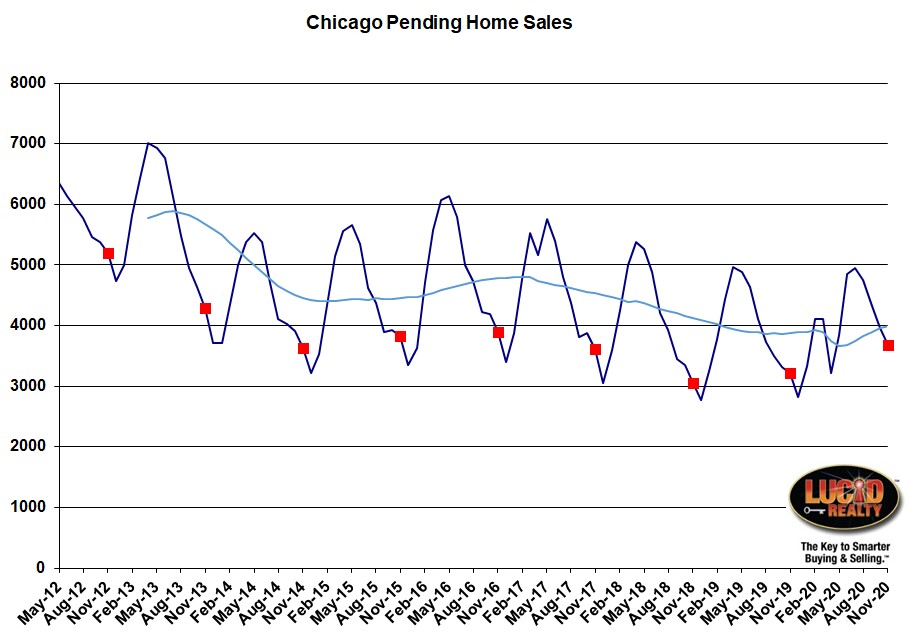
Pending home sales represent contracts written that haven’t closed yet – i.e. they should theoretically close in the next month or two. In the graph below you can see that we’re currently at the highest level in 4 years. We ended November 472 units higher than last year, which is down from October’s 637 unit increase but still significant. When you consider that last year there were 1896 closings in December those extra 472 units could have a significant impact.
Distressed Home Sales
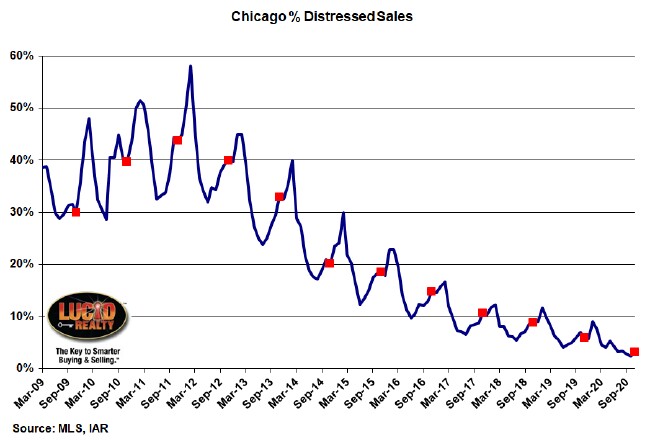
With the moratorium on foreclosures (and I hear that it’s been extended yet again) it should be no surprise that the percentage of home sales that are distressed continues to decline. November only had 3.2% distressed sales, down from 6.0% last year and another record low.
Chicago Home Inventory
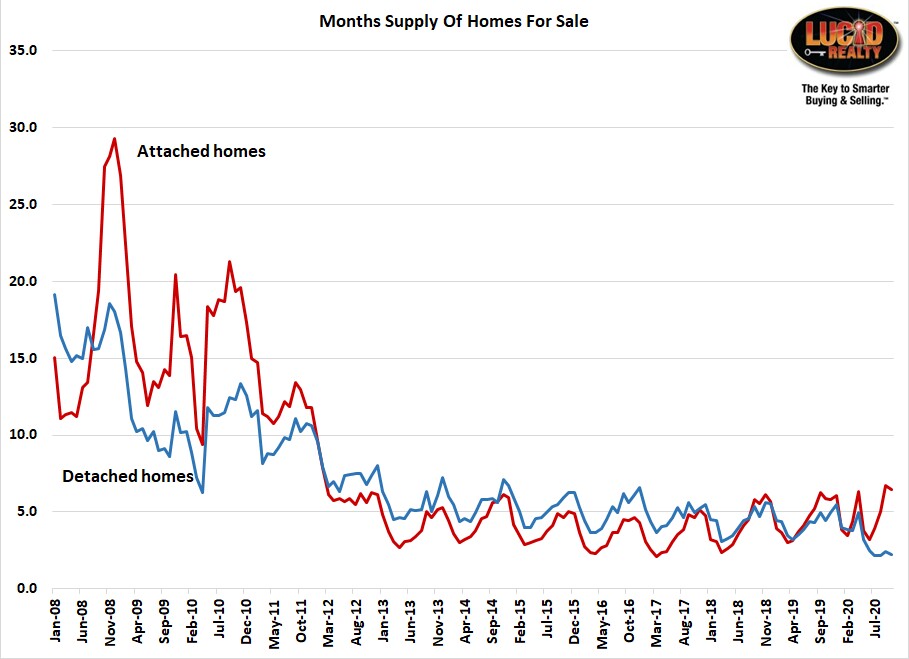
Since the pandemic attached (condos/ townhomes) and detached inventory has been significantly diverging as you can see in the graph below. Everyone has known that detached inventory was extraordinarily low. November had only a 2.2 month supply, which is the lowest level for a November over the time period I’ve been tracking, though it’s up a tiny bit from the July low of 2.1 months.
However, condos are a totally different story with inventory actually rising. Prior to November I wasn’t willing to declare a condo glut because those inventory levels were not really exceeding last year’s levels. But November ended with a 6.8 month supply, which is almost a 9 year high – for any time of year. Clearly, as everyone has been saying, condos are out of favor relative to single family homes.
Chicago Home Sale Market Times
Regardless of the higher inventory levels it sure doesn’t look like condo sellers are having any trouble selling their places based on the market times I’m seeing. For condos that closed in November it only took them 66 days to sell on average, down from 83 days last year. It doesn’t really make sense that condos would sell so fast, given their inventory levels, but maybe condos that aren’t selling are being yanked off the market? By comparison single family homes sold in an average of 63 days, which is down from 76 days last year, but that’s no surprise given the low inventory levels and high demand.
If you visit our Web site you will find some additional Chicago real estate market data.
#RealEstate #ChicagoRealEstate #Coronavirus
Gary Lucido is the President of Lucid Realty, the Chicago area’s full service real estate brokerage that offers home buyer rebates and discount commissions. If you want to keep up to date on the Chicago real estate market or get an insider’s view of the seamy underbelly of the real estate industry you can Subscribe to Getting Real by Email using the form below. Please be sure to verify your email address when you receive the verification notice.
