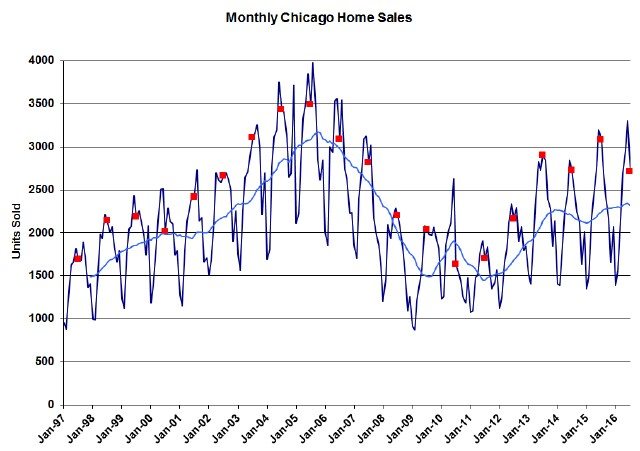
The Chicago real estate market has had a great run over the last 19 months, hitting 10 year highs and occasionally scoring double digit year over year gains despite periodically declining by small amounts. However, that winning streak could be coming to an end if July sales are any indication of what is to come. After hitting a 10 year high in June July home sales declined by 9.3% from last year and it’s been 21 months since we’ve seen a decline of that magnitude.
In a little over 2 weeks the Illinois Association of Realtors will report the official numbers and they will show a 12.0% decline.
If you look at the graph below you will see just how weak this is from a historic perspective since sales were lower than 2 of the last 4 years and that blue 12 month moving average ticked down a bit. I’ll try to offer a few possible explanations for this weak performance as we get into the other statistics below.

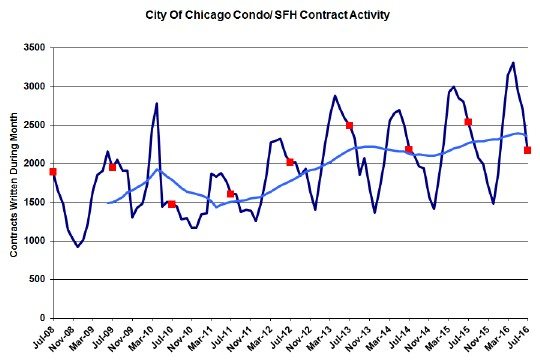
Chicago Home Contract Activity
Similar to the decline in actual closings, contract activity was also weak in July. Now, keep in mind that reporting on contract activity is much less precise than reporting on sales because the historic data excludes contracts that fell apart and it can take many, many months before the final destiny is determined for all the contracts written in a given month. Therefore, I have to estimate how many of the currently active contracts will make it to the finish line. Based upon those estimates it looks to me like July was also weaker than 2 of the last 4 years and the decline from last year was the greatest in 5 years – down 14.5%. And that also brought down the 12 month moving average in July.

Pending Home Sales
The one bright spot in the data is the fact that pending home sales in Chicago actually rose on a months of supply basis in July, suggesting that part of the sales problem could have simply been a timing issue – i.e. some of the sales that could have closed in July will close in August or September instead. Pending home sales rose to a 1.84 month supply compared to last year’s 1.50 months supply. That’s a big difference.
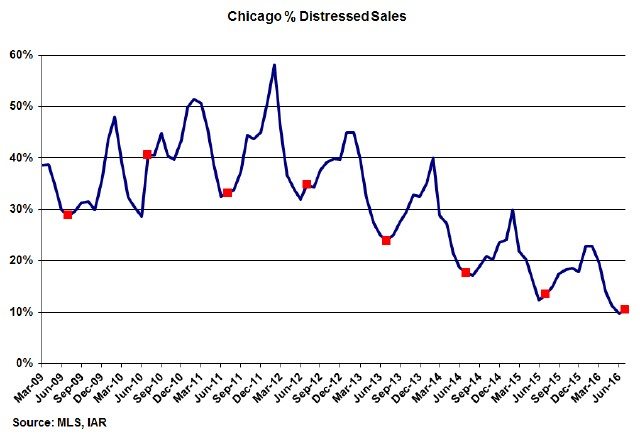
Distressed Home Sales
The share of distressed home sales continued its decline in July, falling to another 8 year low of 10.5% vs. last year’s 13.5%. Clearly the pace of decline is dropping. As you can also see in the graph below, with it being late in the selling season, we are now getting into the time of year when this metric rises as a result of a shift in the mix of what is for sale.
Chicago Home Inventory
Exceptionally low home inventory levels in Chicago are also probably partially to blame for the decline in sales. Buyers are in a real quandary about what to buy. In July there was only a 4.5 month supply of single family homes compared to a 5.5 month supply last year and only a 3.2 month supply of condos and townhomes compared to last year when there was a 4.1 month supply.
Chicago Home Sale Market Times
With inventory so low properties that are reasonably priced sell very quickly. The graph below shows the trend in market time for properties that actually closed in a given month (properties that linger on the market are not included until they actually sell). In July the average market time for condos and townhomes was only 58 days compared to 65 days last year. And single family homes sold on average in 80 days – essentially unchanged from last year’s 81 days. If the market was really weakening I think these numbers would be higher at this point.
#RealEstate #ChicagoRealEstate
Gary Lucido is the President of Lucid Realty, the Chicago area’s full service discount real estate brokerage. If you want to keep up to date on the Chicago real estate market, get an insider’s view of the seamy underbelly of the real estate industry, or you just think he’s the next Kurt Vonnegut you can Subscribe to Getting Real by Email using the form below. Please be sure to verify your email address when you receive the verification notice.

