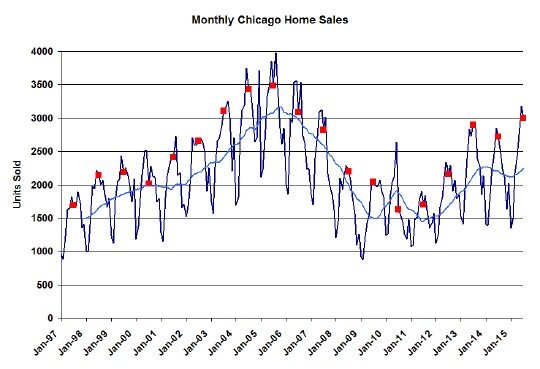
It’s just another month in paradise. The Chicago real estate market continues on a tear with July sales hitting another 9 year record high. In fact, if you look at the graph below, with all the Julys flagged with red squares, you can see that we were within spitting distance of a 10 year high. Looking back over the last 19 years we see that only 4 years had higher home sales and that was during the real estate bubble.
Compared to last year Chicago home sales were up 12.6%, which is the third month of double digit sales increases and also the 6th month of year over year sales. There’s also a blue 12 month moving average in the graph below and you can see how that tracks the recent uptick in sales over the last 6 months.
Now, when the IAR reports in about a week and a half they are going to report a 10.1% increase. They are always lower than me because they compare preliminary figures this year with final figures for last year. I know better than to do that.
Chicago Home Contract Activity
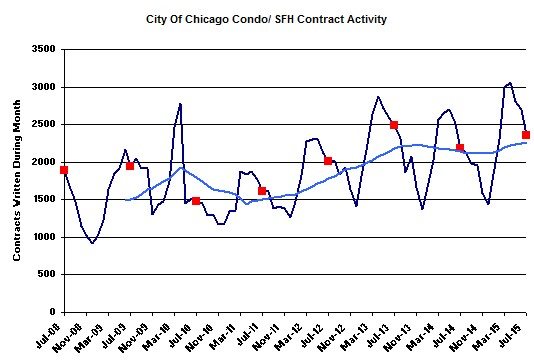
There is a loose but necessary connection between home sale contracts written and sales closed, except that contracts should lead closings by a month or two. The contracts graph below shows basically the same pattern that we’re seeing in the graph above as you would expect.
The year over year growth in the last few months appears to be in the single digits so I would expect the sales gains to start slowing from their recent double digit growth rate. For instance, I’m estimating that July was up 7.6% over last year but my initial estimates lately have proven to be light. That’s because I assume a 20% attrition rate in these early numbers and lately we’ve been doing better than that.
Pending Home Sales
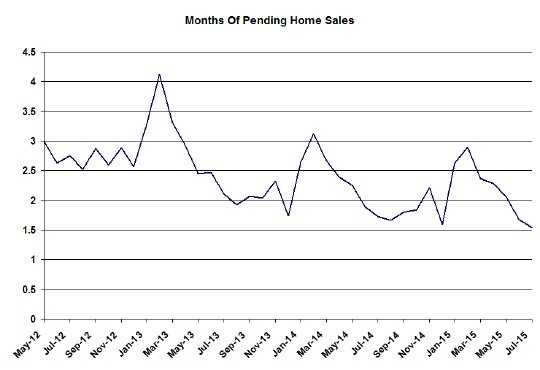
The difference between the contracts written and the sales closed can be seen in the pending home sales numbers that I track in the graph below. I represent them on a months of supply basis so that we have an idea of how many months of sales we could support with just the contracts that have already been written.
July was down to 1.5 months of supply from 1.7 months last year and you can see that this appears to be part of a longer term decline in pending home sales. So deals are closing quicker??? In fact, this July appears to be a record low in this number. This could be related to the secular decline in distressed sales which take notoriously long to close. But make no mistake…this draw down in pending home sales is helping to goose the home sale numbers.
Distressed Home Sales
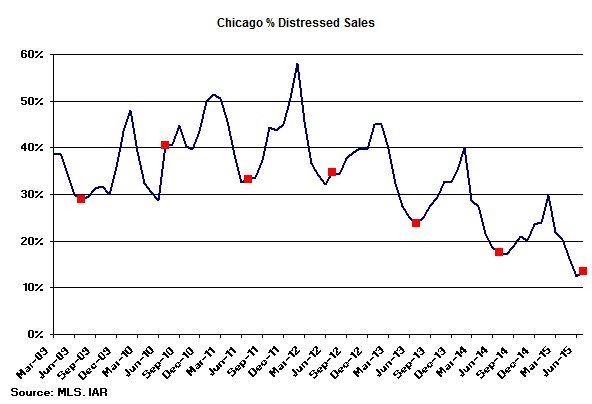
See what I was just talking about? Check out the graph below of the percentage of distressed sales. It’s been plummeting for 3 years now and keeps hitting new record lows. July hit 13.5%. Compare that to the nearly 41% in 2010. Those were the days!
Until recently this decline in distressed sales was so dramatic that it was driving down the year over year home sales numbers. But now the decline is declining and it’s a much more limited effect. Nevertheless, if you take distressed sales out of the equation you get an 18.2% increase in non-distressed home sales for July.
Chicago Home Inventory
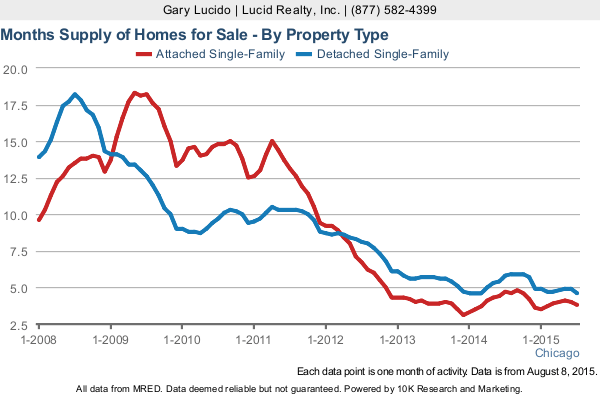
And the home inventory levels just keep getting more and more ridiculously low. You would think it’s impossible but condos and townhomes are down to a 3.8 month supply from 4.7 months last year and detached homes are down to 4.6 months from 5.8 months last year. How much longer can this keep going?
Yes, this is helping to reduce market times and elevate home prices. And, yes, a rising tide lifts all boats. However, lest any unrealistic sellers get the wrong idea, this does not mean that anyone can sell anything at any price in one week. Buyers are still picky enough to avoid bad locations, poorly maintained homes, outdated kitchens and baths, homes that are overpriced for the neighborhood, and undesirable floor plans. At the end of the day there is still competition out there.
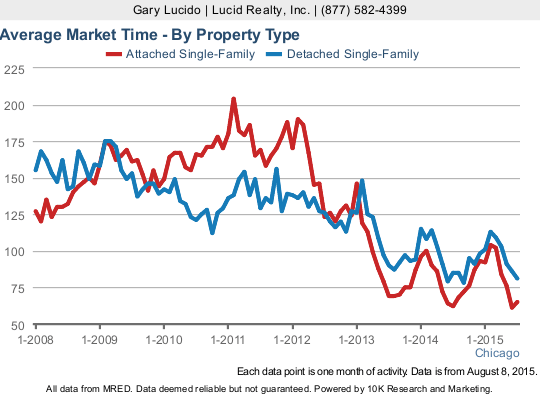
Chicago Home Sale Market Times
Yet, the amount of time it takes to sell homes appears to be flattening out. There was a decline for detached homes to 81 days from 85 days last year but condos and townhomes are actually taking slightly longer to sell this year – 65 days vs. 62 days last year.
But you can see in the graph below just how short this is relative to what it was a few years ago. Clearly it’s a lot easier to sell a decent property at a reasonable price today. So don’t let some traditional realtor convince you that they have magic dust that justifies a high commission. There’s a lot of smoke and mirrors in this business and often what distinguishes a top realtor from all the rest is how good they are at selling themselves.
#realestate #chicagorealestate
Gary Lucido is the President of Lucid Realty, the Chicago area’s full service discount real estate brokerage. If you want to keep up to date on the Chicago real estate market, get an insider’s view of the seamy underbelly of the real estate industry, or you just think he’s the next Kurt Vonnegut you can Subscribe to Getting Real by Email. Please be sure to verify your email address when you receive the verification notice.
