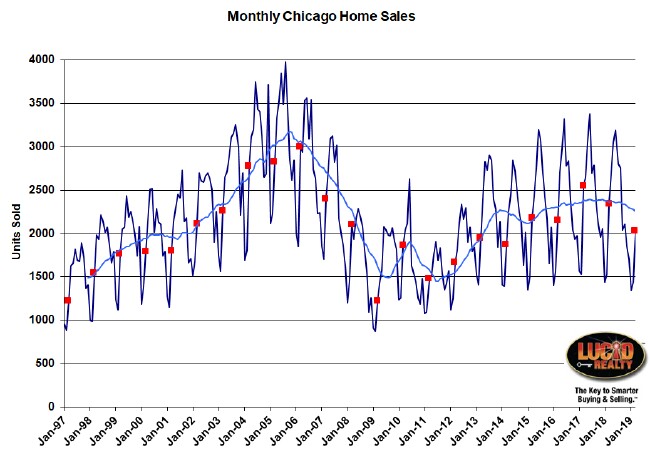
Well, it looks like March was the 5th month in a row that the Chicago real estate market had declining home sales – down a whopping 11.6% from last March. In fact, that was the lowest home sales in 5 years and I should point out that that also means that 11 out of the last 15 months have had declining sales.
You can see all this in the graph below, which flags all the March values in red. In addition, the light blue line is a 12 month moving average that also demonstrates how home sales have been trending down now for a while. Nevertheless, some of the other real estate market metrics discussed below put this in a more favorable light.
In a couple of weeks the Illinois Association of Realtors will provide their official account of what happened in March but they will report a 13.6% decline in sales. We have different views on how to measure the change and they always come in a couple of percentage points lower than me.

Chicago Home Contract Activity
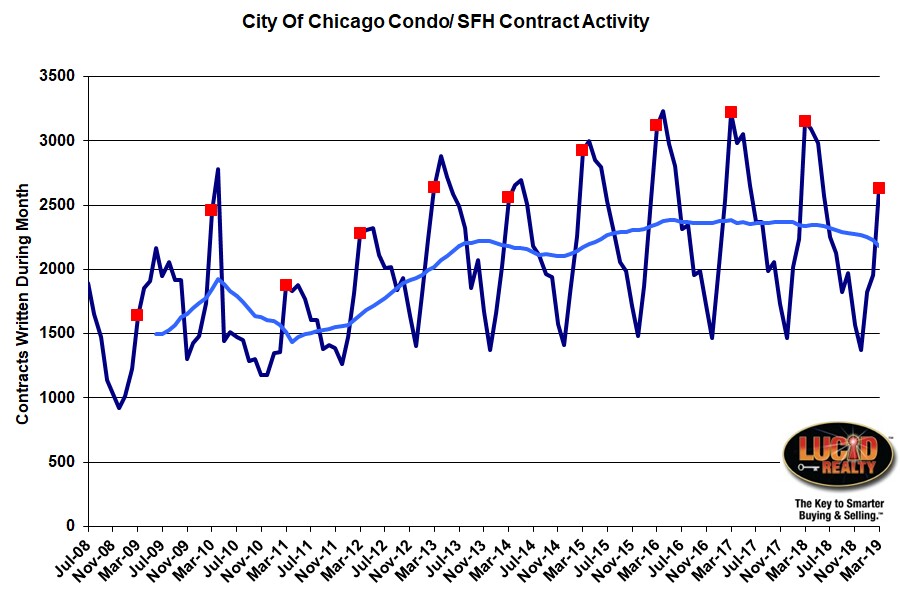
Hmmm. The poor sales performance is reinforced by the low level of contract activity. It looks to me like March experienced a 16.6% decline from last year, which makes it the lowest March in the last 5 years. This particular metric is always an estimate that gets refined each month so it’s hard to tell what really happened. But if I’m correct then this will also be the biggest percentage drop in 8 years!
You can see in the graph how this is affecting the moving average of contracts written. And with this size decline it’s all but certain that April will come in with much lower sales than last year since many of those deals were signed in March.
Pending Home Sales
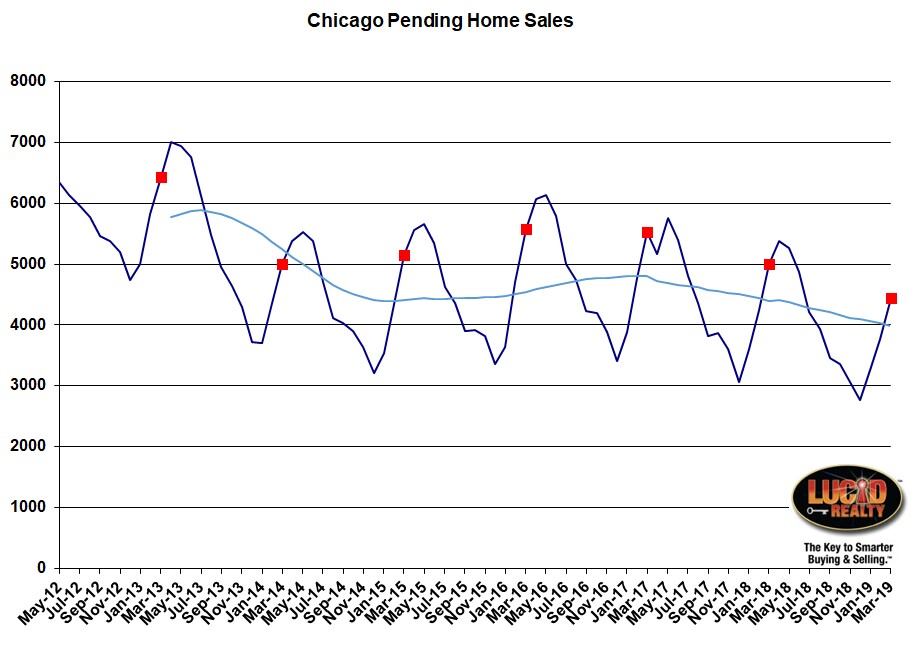
The picture is not very pretty for pending home sales either. These are basically the homes under contract waiting to close and they are down by 557 units from last year, which is quite a lot when you consider that 2025 homes closed in March. And this continues the downward trend we see in the graph below.
Basically the decline in this backlog, possibly from faster closings, is helping to prop up sales but it can’t go on forever. It’s just another indication that future sales are going to be lower.
Distressed Home Sales
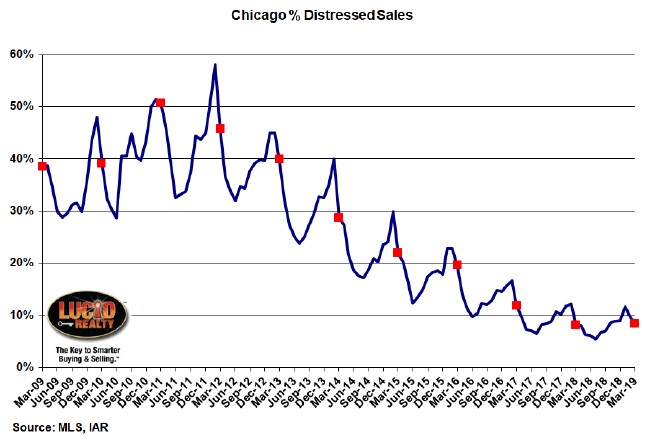
Well, it finally happened. For the first time in 8 years the percentage of home sales that are distressed actually increased. It went from 8.1% last year to 8.4% last month, which is a sure sign that this metric has finally stopped dropping. Hopefully, this is not the start of some kind of upward trend.
Chicago Home Inventory
The inventory of homes for sale, measured in terms of months of supply, is one of two indicators (the other one is below) that paints a brighter picture of the Chicago real estate market than what you would conclude from declining sales. Inventory is low so it should be no surprise that sales are low when there is little to buy.
However, the inventory of detached and attached homes are moving in opposite directions though both are still considered low by historic standards. Detached inventory fell from a 3.9 month supply last year to a 3.4 month supply last month while attached inventory rose from a 3.3 month supply to a 3.8 month supply. Their lines had been converging and finally crossed in February for the first time in 6 years.
Chicago Home Sale Market Times
The other real estate market indicator that flashes a fairly positive indication is how long it takes to sell a home in Chicago. If the market was really weak then these two measures would not be as low as they are. In March the detached homes that closed took 111 days to go under contract, which is not that long, and it was actually slightly shorter than the 114 days that it took for the homes that closed last March. By comparison attached homes actually took a bit longer this year – 96 days, up from 88 days last year. But that’s still pretty fast.
You can also check out our Web site for additional data on the Chicago real estate market that we maintain that may be of interest to you.
#ChicagoRealEstate #RealEstate
Gary Lucido is the President of Lucid Realty, the Chicago area’s full service real estate brokerage that offers home buyer rebates and discount commissions. If you want to keep up to date on the Chicago real estate market or get an insider’s view of the seamy underbelly of the real estate industry you can Subscribe to Getting Real by Email using the form below. Please be sure to verify your email address when you receive the verification notice.


