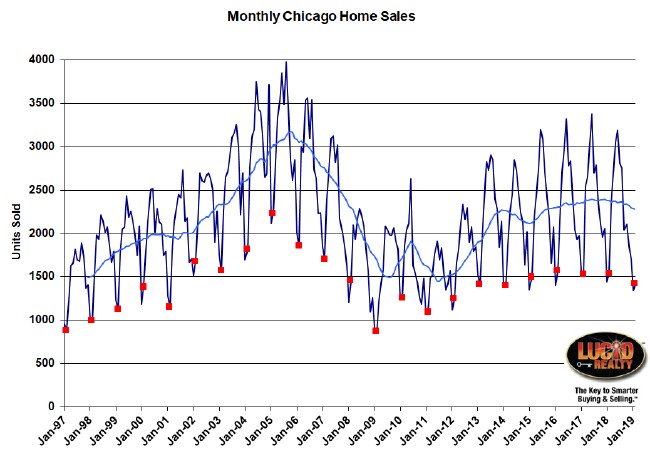
February was the 4th month in a row that the Chicago real estate market had lower home sales than the previous year. In fact, if not for October home sales being just a smidgen higher than 2017, February would have been the 7th month in a row of lower sales. The February decline was 4.6% from last year. You can see from the lighter blue moving trendline in the graph below how sales have been trending down for several months now.
The “good” news though is that 4.6% is actually the smallest percentage loss in the last 4 months. However, looking at the graph below, with all Februaries flagged in red, you can also see that last month’s sales were the lowest in 5 years.
In a couple of weeks the Illinois Association of Realtors will release their official numbers for February and I expect them to report a 7.4% decline. We disagree on methodologies.
Despite lower sales numbers I continue to assert that the Chicago real estate market is fundamentally strong as I explain below.

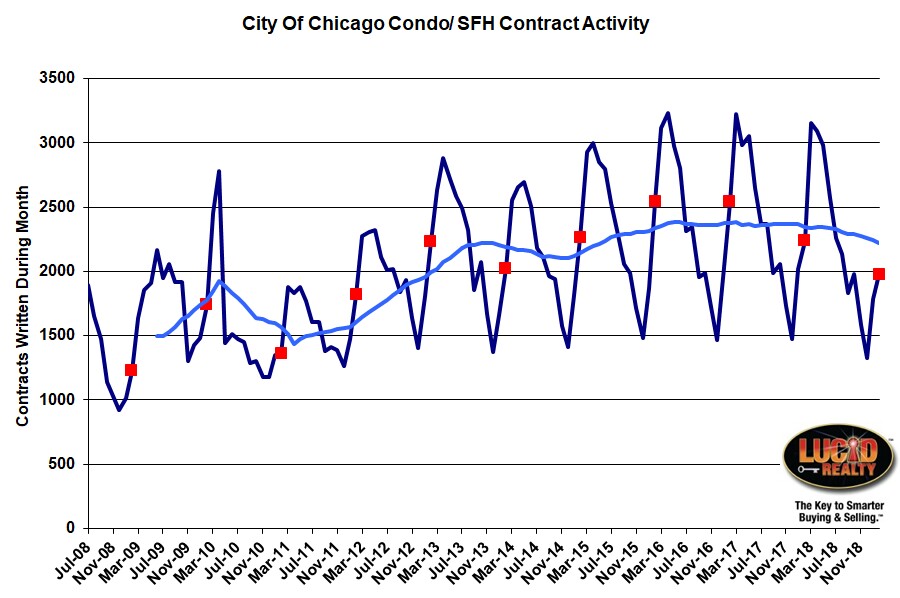
Chicago Home Contract Activity
Looking at contracts written, which lead closings by 1 – 2 months, we see the same overall declining sales trend. Contracts written have been down year over year in 13 of the last 14 months, which is why that light blue trend line in the graph below is pointing downward. And February also registered the lowest activity in 7 years, with contracts down 11.9% from last year. It’s just further evidence that home sales will be down again in March.
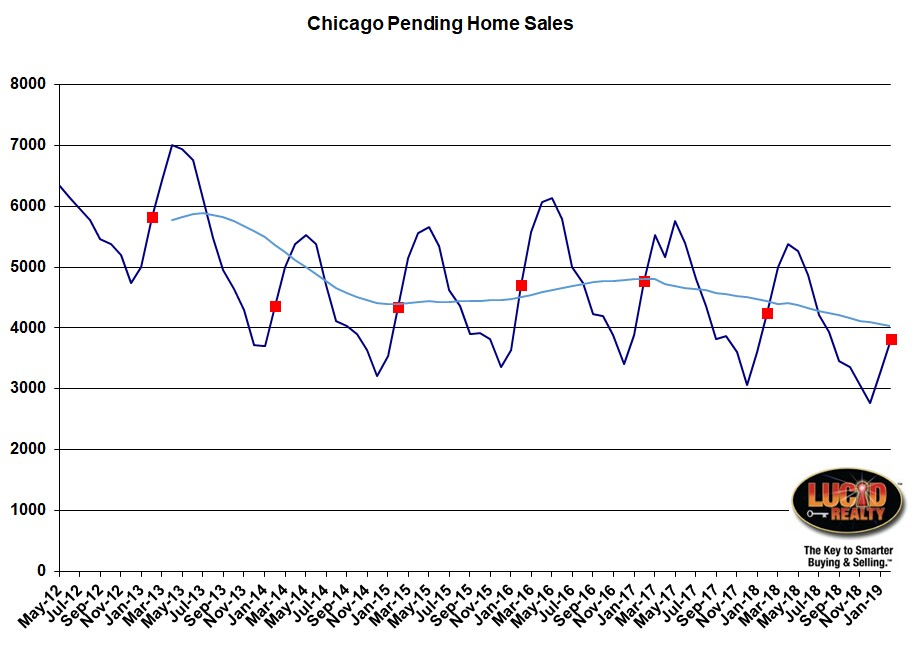
Pending Home Sales
Pending home sales (the backlog of homes under contract waiting to close) also tells us a pretty bleak story. February has the lowest level since I’ve been tracking it and we were down by 482 units from last year. That means that some of February’s sales came from raiding the closing bank which is not sustainable.
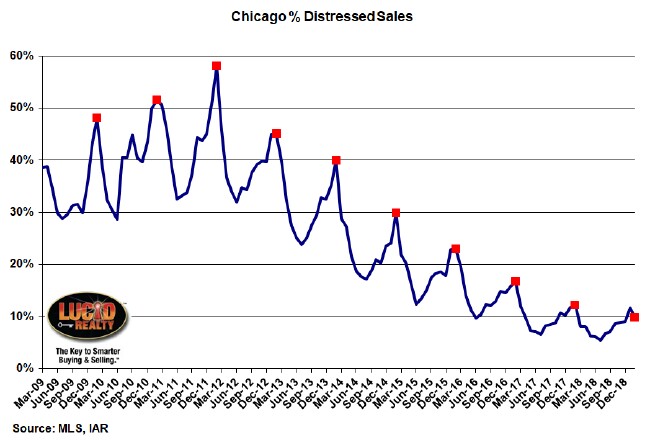
Distressed Home Sales
The percentage of home sales that were distressed continued its downward march, hitting a new low since I’ve been keeping track. Although we are getting really close to the bottom we managed to eke out another 2.4% decline from last year, dropping to 9.8%.
Chicago Home Inventory
So much for all the sales related metrics. Inventory levels tell us a lot about the health of the real estate market and, so far, it looks pretty good. Sure, the inventory of attached homes (condos and townhomes) is rising – we’ve gone from a 3.0 month supply last year to a 3.4 month supply this year – but we are still at extraordinarily low levels. And the inventory of detached homes has actually declined by quite a bit. Last year we had a 4.0 month supply and now we are down to a 3.2 month supply. Notice that after years of attached inventory running lower than detached inventory they have finally switched places.
So inventory levels seem to suggest that maybe they are actually the cause of low sales – low supply vs. low demand.
Chicago Home Sale Market Times
Market times lend credibility to my theory that demand is still strong and that supply is constricting sales. Both attached and detached market times are at the lower end of the recent range though attached market times have recently risen. Detached homes that closed during February took only 107 days to go under contract compared to 110 days last year. Attached homes rose to 109 days from 98 days last year, which is consistent with the fact that inventories of this type of home has risen in the past year.
Our Web site has additional Chicago real estate market data that we keep up to date that may be of interest to you.
#ChicagoRealEstate #RealEstate
Gary Lucido is the President of Lucid Realty, the Chicago area’s full service real estate brokerage that offers home buyer rebates and discount commissions. If you want to keep up to date on the Chicago real estate market, get an insider’s view of the seamy underbelly of the real estate industry, or you just think he’s the next Kurt Vonnegut you can Subscribe to Getting Real by Email using the form below. Please be sure to verify your email address when you receive the verification notice.


