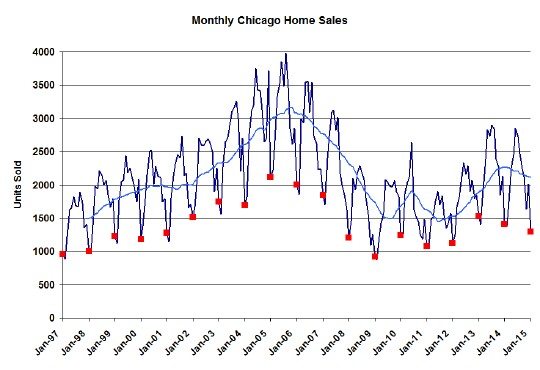
It looks like the Chicago real estate market is starting 2015 with the same general trend that was in effect for much of 2014. Technically home sales were down for the 2nd year, dropping an additional 6.4% from last year’s slightly lower January numbers. However, in about 2 weeks, the Illinois Association of Realtors will report sales down 8.0% for January due to, what I believe is, their flawed methodology.
But looking at just non-distressed sales, which are an increasing share of the Chicago real estate market, home sales are actually at the highest level in 8 years – up 9.6% from last January. As the year progresses, and we start comping against numbers that already have fewer distressed sales in them, we will start to see even the top line numbers growing.
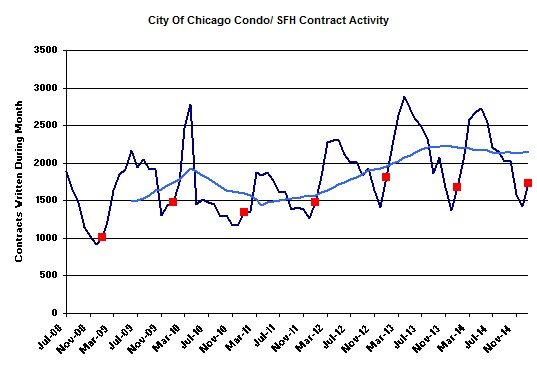
Chicago Home Contract Activity
Contract activity has been tracking pretty flat to last year as you can see in the graph below. The blue moving average line has flattened and I’m estimating that January was up 3.2% from last year. What this means is that home sales should be pretty flat to last year for the next month or two.
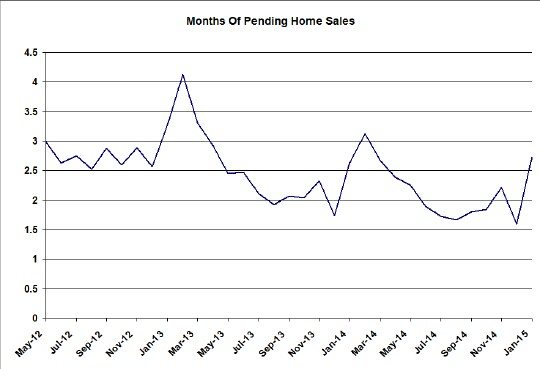
Pending Home Sales
The difference between the slightly stronger contract activity and the slightly weaker sales numbers is explained by the increase in pending home sales in Chicago. As happens at this time of year, we’ve gone up to a 2.7 month supply of pending home sales. Check out the graph below.
This buys us some cushion for future months which might manifest itself in higher year over year sales in February and beyond.
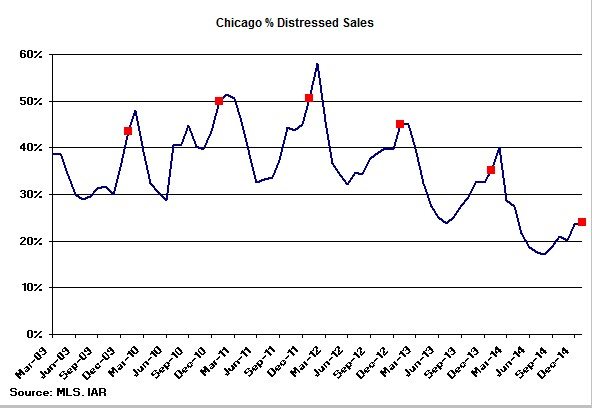
Distressed Home Sales
Distressed home sales continue to make up a declining share of the Chicago real estate market and that’s what’s driving overall sales down. This is the third year that the share has declined. January came in at only 24.1%, down dramatically from the peak in 2012 of 50.6%.
Chicago Home Inventory
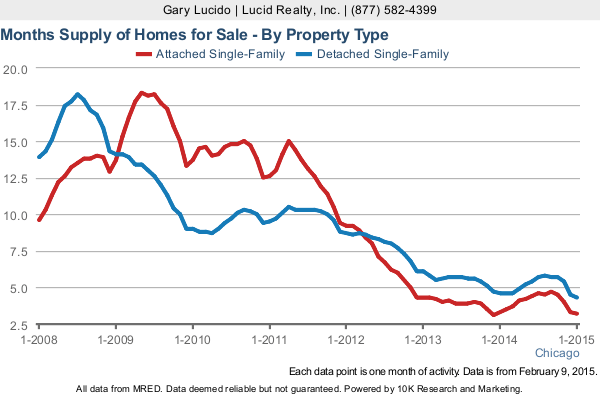
Home inventory levels also continue to decline, which also helps explain the weak sales levels. You can see the dramatic downward trend in the graph below but you may not be able to discern that we hit new record low levels of inventory for a January. Detached homes were at only a 4.3 month supply and attached homes hit a shockingly low 3.2 month supply.
Chicago Home Sale Market Times
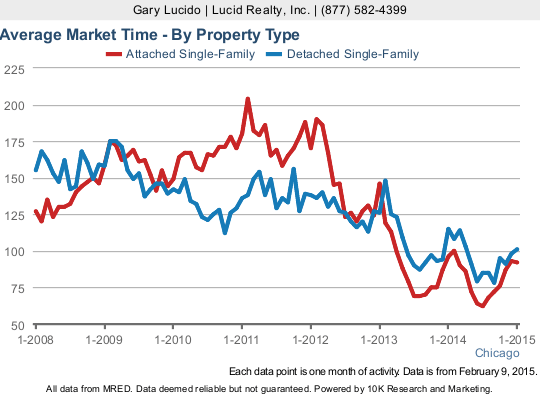
And the average market times for properties that sell is also at record low levels for this time of year, but this is a time of year with seasonally high market times. Attached homes that sell do so in only 92 days but detached homes take a bit longer at 101 days.
#realestate #chicagorealestate
If you want to keep up to date on the Chicago real estate market, get an insider’s view of the seamy underbelly of the real estate industry, or you just think I’m the next Kurt Vonnegut you can Subscribe to Getting Real by Email. Please be sure to verify your email address when you receive the verification notice.
