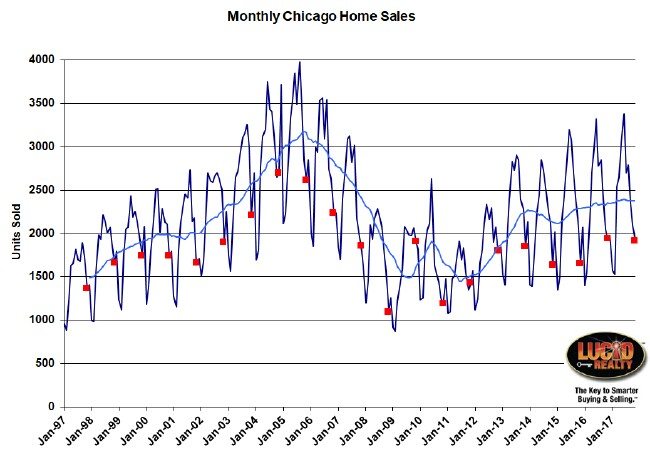
I picked that headline because it’s a nice attention grabber. It’s technically true but it doesn’t really tell the whole story, which is much more disconcerting. While the Chicago real estate market did have it’s strongest home sales in 11 years November was only up 2.2% from last year and up only 3.4% from November 2009 (which might have been goosed by some silly government home buying incentive – I don’t remember the timing of that). In reality the market is stalling, as is evident by the light blue moving average line in my graph below. That graph shows Chicago’s home sales history back to 1997 with all the November values flagged in red.
When the IAR reports on home sales in a couple of weeks they will show home sales down 0.7% from last year because of a flaw in their reporting methodology.

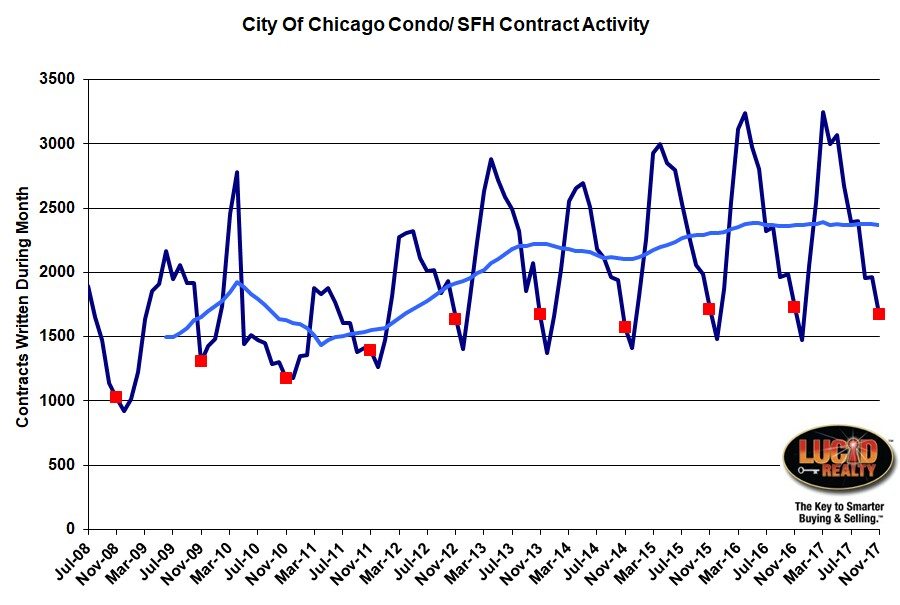
Chicago Home Contract Activity
Once again the home contract activity data confirms that the Chicago real estate market has stalled. I’m currently estimating that November contract activity was down 3.4% from last year and was lower than of the last years. Also, as you can see in the graph below, the moving average line has pretty much flatlined lately.
No growth in contract activity means no growth in closings and we’re not likely to see any real closing growth for the next 2 months or so.

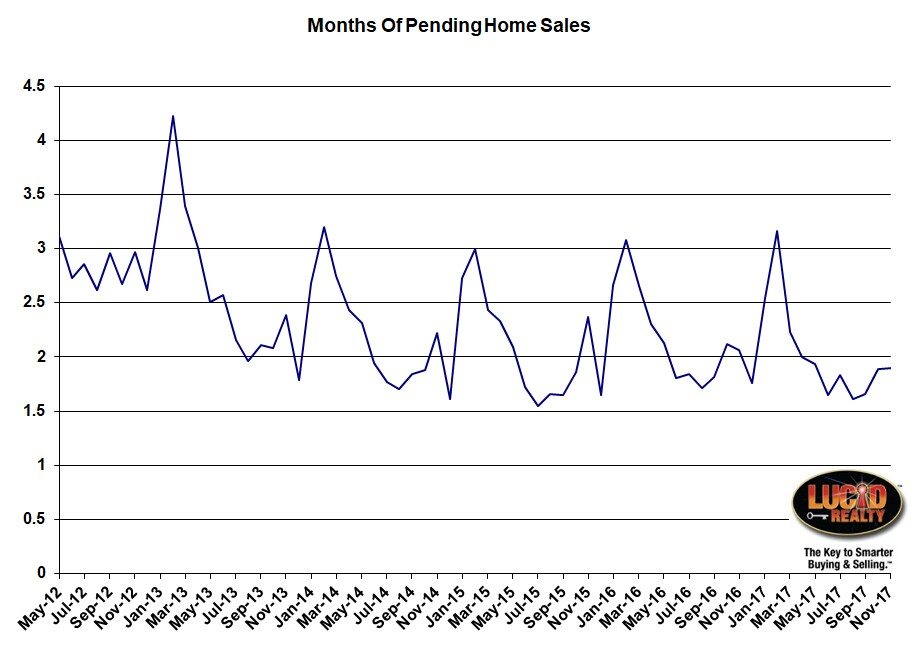
Pending Home Sales
Pending home sales did decline slightly from last year – 1.88 months of supply, down from 2.07 months. That means that more of the deals in the pipeline closed than previously, which boosts sales slightly without any more contracts being written. But there is a limit to how much of your sales you can get from that bag of tricks.
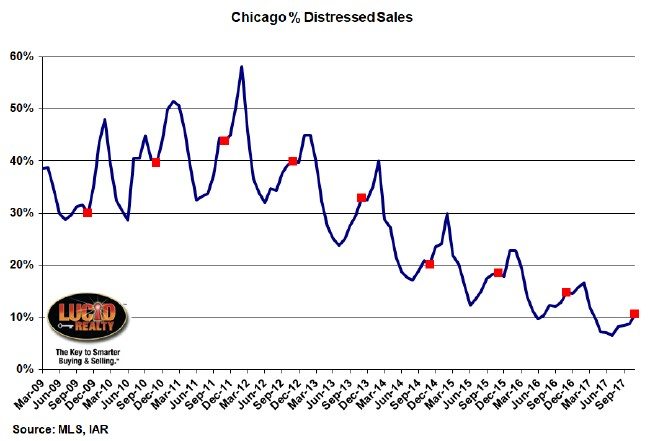
Distressed Home Sales
As has been the case now for 6 years, the percentage of sales that are distressed has been on the decline, hitting new lows every month. November dipped to 10.7% from 14.8% last year, though the percentage does rise at this time of the year. The year over year declines keep getting smaller but we are still dropping about 4% per year right now.
Chicago Home Inventory
Surprise, surprise, surprise! Home inventory continues to drop. We just keep hitting ridiculously low levels. In November the supply of detached single family homes hit a measly 4.0 months, down from 4.9 months last year, while the supply of condos and townhomes hit 3.0 months, down from 3.1 months last year.
These numbers, and even the trends, can vary substantially from one area of the city to another. But in general the supply of homes for sale is so low that it is believed to be the cause of our stagnating sales.
Chicago Home Sale Market Times
The real surprise is that market times haven’t shrunk more. They are indeed low still but they actually rose slightly in November over last year. The average market time of detached homes was 88 days compared to 85 days last year and condos and townhomes sold in 71 days compared to 68 days last year. These are not huge increases but they are still a bit odd, given how low inventory is.
You can find additional Chicago real estate data on my Web site that I update on a regular basis.
#RealEstate #ChicagoRealEstate
Gary Lucido is the President of Lucid Realty, the Chicago area’s full service discount real estate brokerage. If you want to keep up to date on the Chicago real estate market, get an insider’s view of the seamy underbelly of the real estate industry, or you just think he’s the next Kurt Vonnegut you can Subscribe to Getting Real by Email using the form below. Please be sure to verify your email address when you receive the verification notice.

