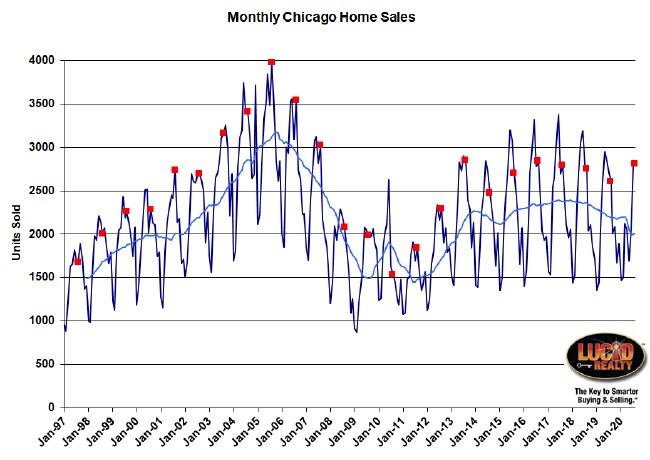
Well, August wasn’t too bad for the Chicago real estate market. Home sales were up 10.6% from last year but, frankly, I expected more, given that July contract activity was so strong. You can see where August fell relative to history in the graph below which has all previous Augusts flagged in red. This is the highest level of closings in 4 years.
If you look at the light blue 12 month moving average line in the graph you can see where sales fell off the cliff and are trying to come back but we have a long way to go to make up for all the lost sales from the Covid-19 fallout during April – June. I don’t think it’s going to happen.
Oh…and in two weeks the Illinois Association of Realtors will come out with the official Chicago real estate market statistics. They will report an 8.0% increase in sales due to their flawed methodology.

Chicago Home Contract Activity
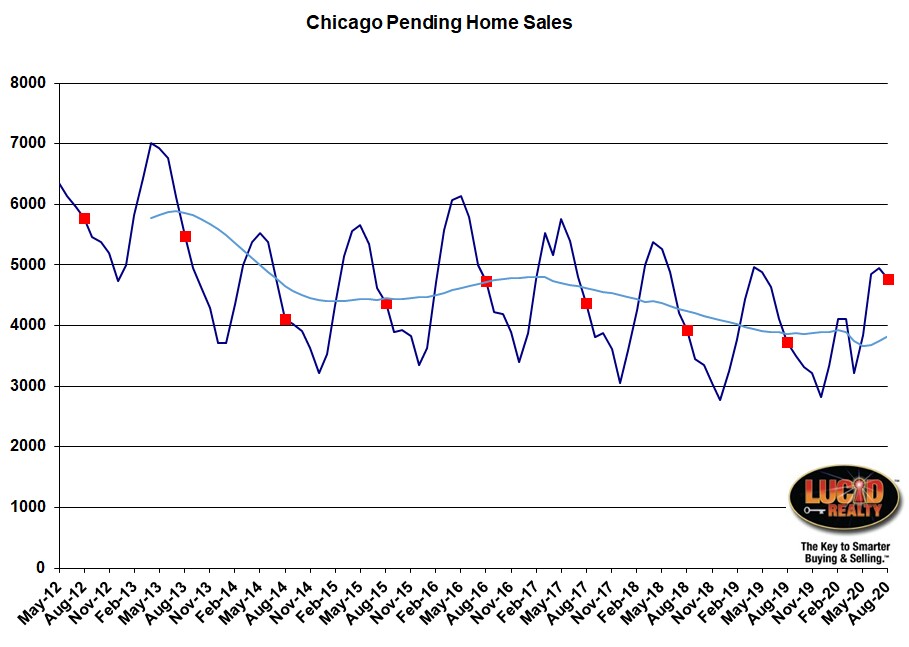
Check out the contract activity graph below. Remember that July was up 30.6% from last year but now August is up 26.0% to another record level for this time of year. You can see the cumulative effect in that light blue moving average line and it looks like we are making a lot of progress. That’s why I think September should show a much larger increase in closings than August. As I’ve pointed out before, the 2020 Chicago real estate market has been shifted out a couple of months.
Pending Home Sales
If you have a lot of contract activity that doesn’t quickly translate into home sales what happens to all those contracts? Well, those contracts can either fall apart or they can sit in pending home sales. When I report the contract activity above I already allow for a normal rate of termination so it’s no surprise that pending home sales are surging right now. If you look at the graph below you’ll see that we just hit the highest August level in 7 years. It’s up from last year by 1030 units. So that’s just further evidence that September closings should be really strong and we’ll probably continue to see that effect into the remainder of the year.
Distressed Home Sales
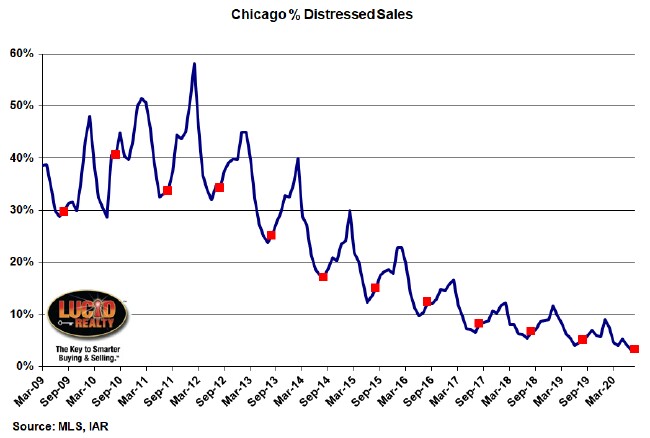
The distressed home sale portion of the Chicago real estate market managed a further decline in August, sinking to a mere 3.4% from 5.1% last year. Of course, that’s another record low, as dramatically demonstrated in the graph below.
Chicago Home Inventory
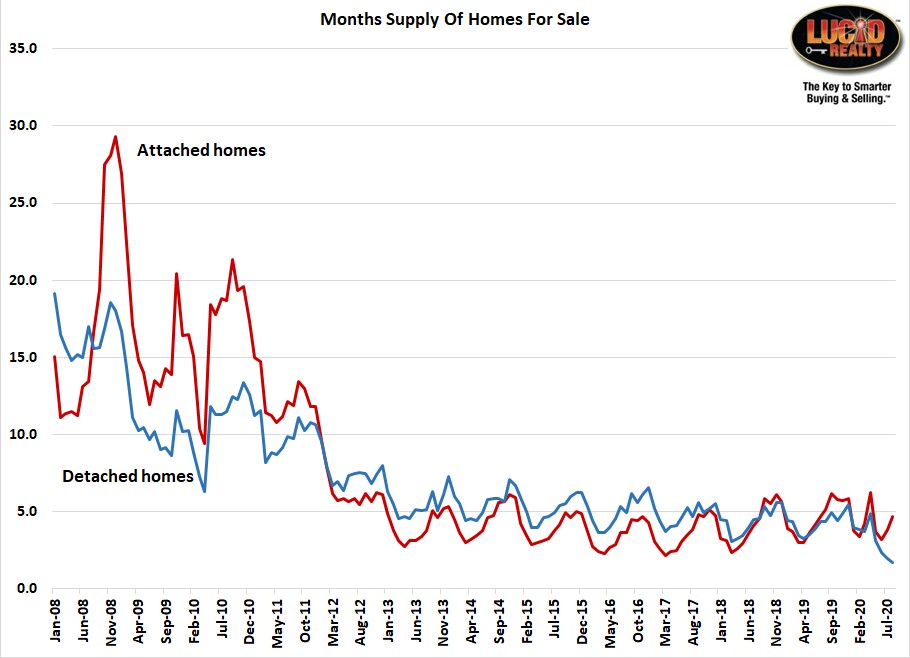
The available inventory of homes for sale in Chicago is developing into an even more interesting story. We knew inventory was tight but now we are seeing a dramatic divergence between the inventory of detached and attached homes.
Remember that, since this whole Covid-19 fiasco, I switched to my own calculation of months of supply so that I could more accurately reflect what’s going on right now. In the graph below I calculate months of supply by dividing available inventory by contracts written during the month. This is critical because, while inventory has recently surged, so has contract activity. Again, the real estate market has shifted out a couple of months.
Consequently, what we see in the graph below is that detached inventory hit another record low of only a 1.7 month supply while attached inventory is on the rise. While attached inventory hit 4.7 months that’s not a record for this time of the year and it’s actually lower than last year’s 5.1 month supply.
What does all this tell us? Well, it basically confirms what the news has been telling us. Condos are out of favor as people stuck at home want the larger space afforded by a single family home. Later this week I’ll expand more on this topic when I show you some data about how the suburbs are doing relative to the city.
Chicago Home Sale Market Times
The graph below shows the average market times for attached and detached homes in Chicago. There hasn’t been much change from last year with attached flat at 68 days and detached up from 70 days last year to 74 days this year. That’s rather surprising, given how low detached inventory is right now.
However, oddly enough, median market times (I’m not going to throw another graph at you) are down pretty significantly from last year. Half of attached homes sold in 23 days or less this year compared to 36 days last year while half of detached homes sold in 27 days or less compared to 34 days last year. So properties priced well are selling much faster now but overpriced properties are lingering on the market much longer (because the average is about the same).
You can also find additional data on the Chicago real estate market on our Web site.
#RealEstate #ChicagoRealEstate #Coronavirus
Gary Lucido is the President of Lucid Realty, the Chicago area’s full service real estate brokerage that offers home buyer rebates and discount commissions. If you want to keep up to date on the Chicago real estate market or get an insider’s view of the seamy underbelly of the real estate industry you can Subscribe to Getting Real by Email using the form below. Please be sure to verify your email address when you receive the verification notice.


