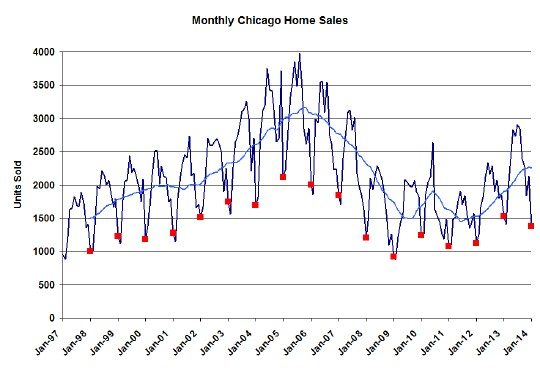
Well, don’t say I didn’t warn you. For some time I’ve been talking about all the indications showing that the Chicago real estate market was slowing down. The writing was pretty much on the wall when I did my January Chicago real estate market update for December. Contract activity was slowing down and the only thing that kept December sales reasonably strong was the fact that we closed a lot of pending deals before the end of the year.
January closings were down about 7.1% but when the Illinois Association of Realtors announces the numbers in 2 weeks their number will be more like 9.4%. Of course, my numbers are more accurate. Unfortunately this breaks a 30 month streak of ever increasing home sales over the previous year. Yet, this makes this January the second highest of the last 7 and corresponds roughly to our sales level back in the 2001/ 2002 time frame.
And, no, I’m not blaming the weather. January closings were pretty much set in December before the weather got totally miserable.
The IAR will also report on median home prices, which were up 28.2% over last January, but my usual caveat holds: this does not indicate a change in home prices but mostly a change in the mix of homes sold, which is definitely skewing upwards.
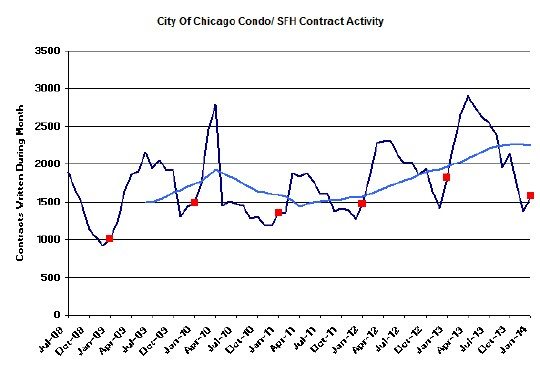
Chicago Home Contract Activity
Contract activity continues to trend down, with this January about 13% below last year’s level, which is the biggest percentage drop since April 2011. Nevertheless, this January was higher than 4 of the last 5 years.
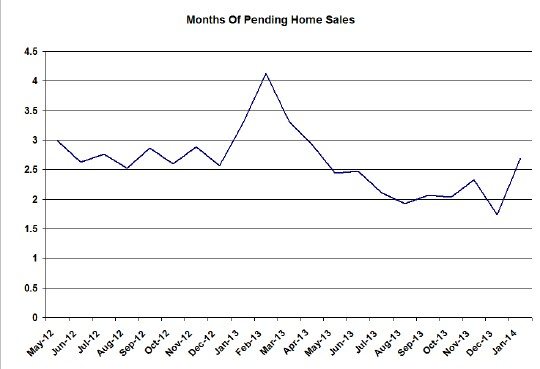
Pending Home Sales
At least we didn’t draw down pending home sales to achieve the closings that we did. On an absolute basis pending sales were basically flat to last month. However, I prefer to look at the months of supply of pending home sales since it gives you an idea of how many months of closings you can support with the current level of pending home sales. Months of supply actually increased since we are at a low point in sales activity for the year.
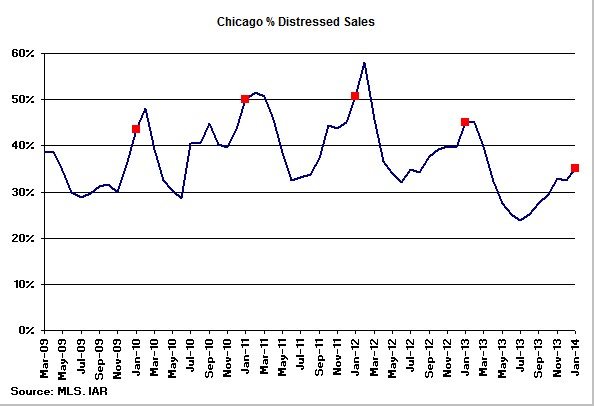
Distressed Home Sales
It was another month of record low distressed sales as a percentage of total sales. January came in at 35.1%. You can clearly see the downward trend in the graph below. We are even running out of foreclosures in this tight real estate market.
Chicago Home Inventory
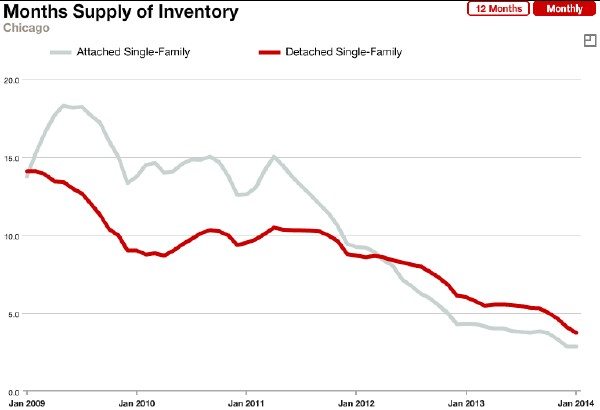
Record low home inventory levels are really the key to the whole story lately and probably the most likely explanation as to why sales have started to fall off. With nothing to buy buyers are left out in the cold – not good given our weather lately. January had only a 2.8 month supply of condos and townhomes and only a 3.7 month supply of single family homes. And as every month goes by the numbers just keep getting lower, though there may be some signs of flattening for condos and townhomes in the graph below. Well, heck, inventory can’t go below zero.
Chicago Home Sale Market Times
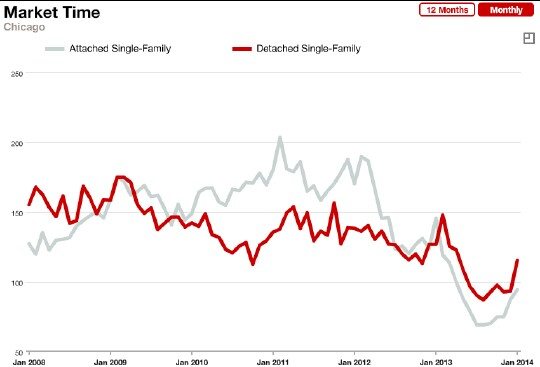
Well, this was the big surprise for me. Look at how much market times have moved up lately. It’s a real spike from a low of 87 days to 115 days for single family homes and a spike from 69 days to 94 days for condos and townhomes. This totally caught me off guard because with low inventory levels you would expect properties to be flying off the shelves. So what is going on here? Are the properties left on the market now priced higher than comparable properties on the market a few months ago?
If you want to keep up to date on the Chicago real estate market, get an insider’s view of the seamy underbelly of the real estate industry, or you just think I’m the next Kurt Vonnegut you can Subscribe to Getting Real by Email. Please be sure to verify your email address when you receive the verification notice.
