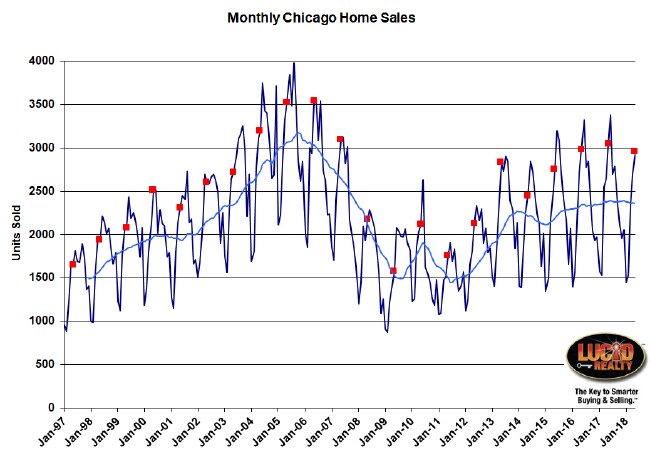
The Chicago real estate market technically hit another 11 year high in home sales in May, though others might disagree with my conclusion. At this point the May numbers are still fairly preliminary so I always compare them to the preliminary numbers from previous years. On that basis sales were up 0.2% from last year and also higher than 2016.
The reason others – especially the Illinois Association of Realtors – might disagree is that they incorrectly compare the preliminary numbers to the final numbers from previous years. On that basis the IAR will report a 2.2% decline in two weeks.
In the graph below I show actual monthly sales going back to 1997 with all May data points flagged in red. You can see the problem I’m referring to in that this May looks lower than the previous 2 years. But once the final numbers come in May 2018 will rise.
The other thing noticeable in the graph below is that the lighter blue moving average line plainly shows just how stagnant home sales are in general. These occasional anemic records just aren’t high enough to lift it signficantly.

Chicago Home Contract Activity
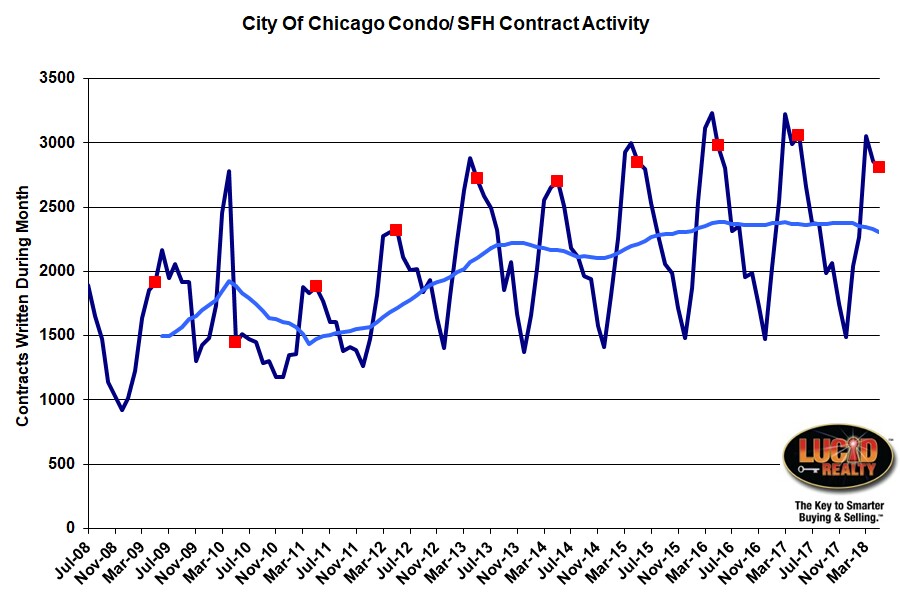
You can see where home sales are going just by tracking contract activity. Theoretically contract activity should lead home sales by about a month or two. In the graph below you can see the history and, again, activity is anemic as is clearly evident from both the flagged May data points and the moving average line. May marked the 4th consecutive month of declining contract activity with an 8.7% decline from last year. Clearly it’s going to be a struggle going forward for home sales to show any improvement over last year.
Pending Home Sales
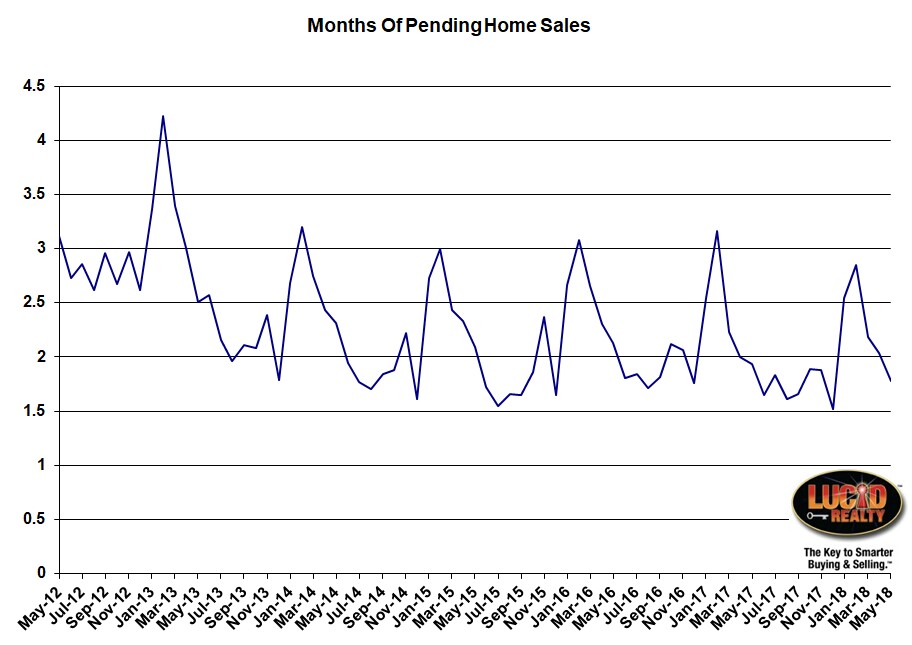
So if contract activity has been so negative how is it that closings can hit record highs? The answer is shown in what is happening to pending home sales. This backlog of closings is being drawn down. We ended May at a 1.76 month supply of closings, compared to a 1.94 month supply last year. But this backlog can only go so low since there is a theoretical limit to how quickly transactions can move into and out of this pipeline. So don’t look to this cookie jar to goose future closings much longer.
Distressed Home Sales
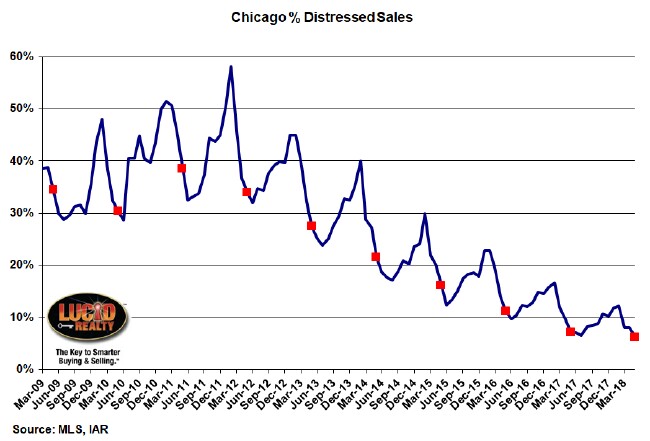
The percentage of home sales that are distressed continues to fall, setting new records each month. In May we hit 6.2% compared to 7.2% last year. Looking at the graph below I think it’s more clear than ever before that the rate of decline from the previous year has really fallen off as we approach zero.
Chicago Home Inventory
The inventory of homes for sale is probably the biggest driver of the low sales volume. As you can see in the graph below we are operating at near record low levels. Well, actually, detached homes are at a record low level of only a 3.7 month supply, down from last year’s 4.9 month supply – a huge drop. The inventory of attached homes (condos and townhomes), however, rose from a 3.2 month supply to a 3.5 month supply. As you can see in the graph below this is the closest the two types of inventory have been since early 2012.
Chicago Home Sale Market Times
In May market times (how long it took the homes that actually sold to go under contract) went in the direction you would expect based upon the inventory changes described above. So detached homes sold in only 80 days, down from 99 days last year but attached homes took longer to sell this year – 62 days up from 52 days last year. So the universe makes sense for a change.
Just a reminder that you can always find this and other real estate market data for the Chicago area on our Web site.
#RealEstate #ChicagoRealEstate
Gary Lucido is the President of Lucid Realty, the Chicago area’s full service discount real estate brokerage. If you want to keep up to date on the Chicago real estate market, get an insider’s view of the seamy underbelly of the real estate industry, or you just think he’s the next Kurt Vonnegut you can Subscribe to Getting Real by Email using the form below. Please be sure to verify your email address when you receive the verification notice.


