I don’t think it was a coincidence that the Chicago real estate market had its worst year over year sales decline in 18 months in January right after having its strongest growth in 9 months during December. As I’ll explain in more detail below, and I alluded to this in last month’s post, I believe that December borrowed some of January’s closings to achieve what it did.
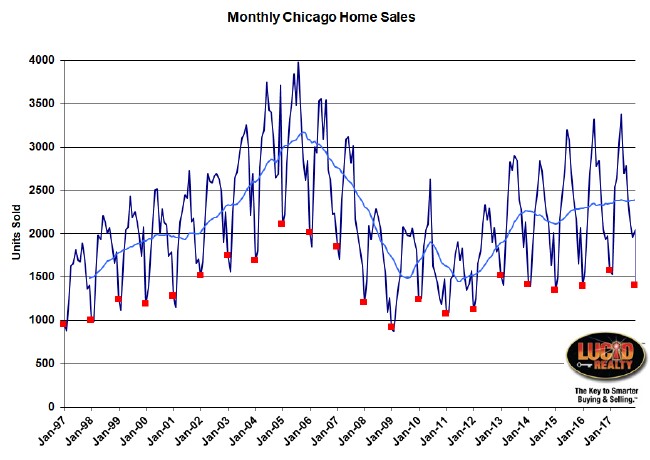
January home sales were down by 7.5% over last year. However, if you look at the long term home sale graph for Chicago below, with all the Januaries flagged in red, you will also see that sales were higher than 8 of the previous 10 years. The only thing is that we really haven’t gained much in the last 6 years. In fact, January home sales were lower than they were in 2013.
Note that when the Illinois Association of Realtors reports the home sale numbers in two weeks they will show an even gloomier picture with a 10.1% decline. There is a flaw in their methodology which causes them to report lower numbers than me but they will no doubt find some way to put a positive spin on it.

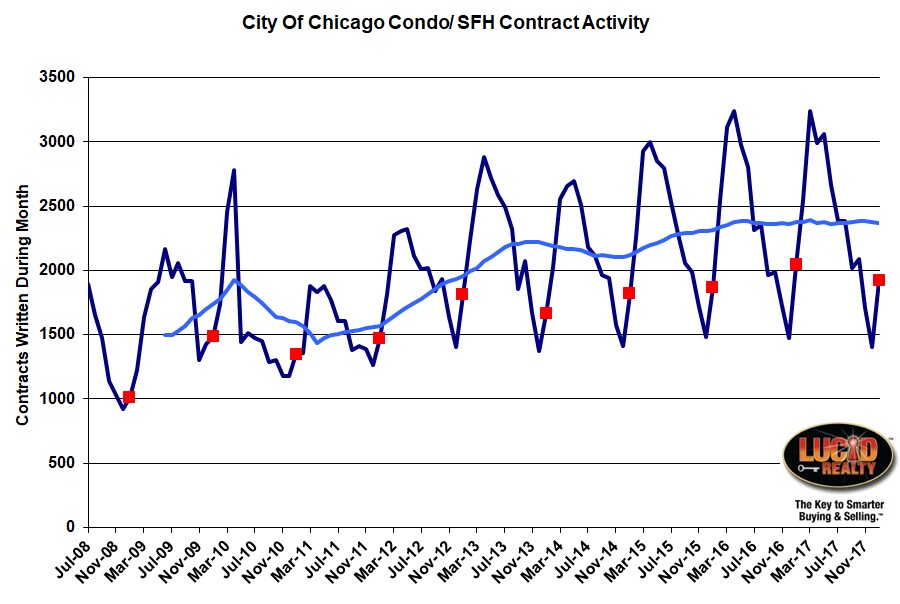
Chicago Home Contract Activity
The number of contracts written on homes during January is much the same picture as you can see in the graph below. I’m estimating that contract activity was down by 6.4% and clearly activity has stagnated in the last few years. This doesn’t bode well for closings over the next couple of months.

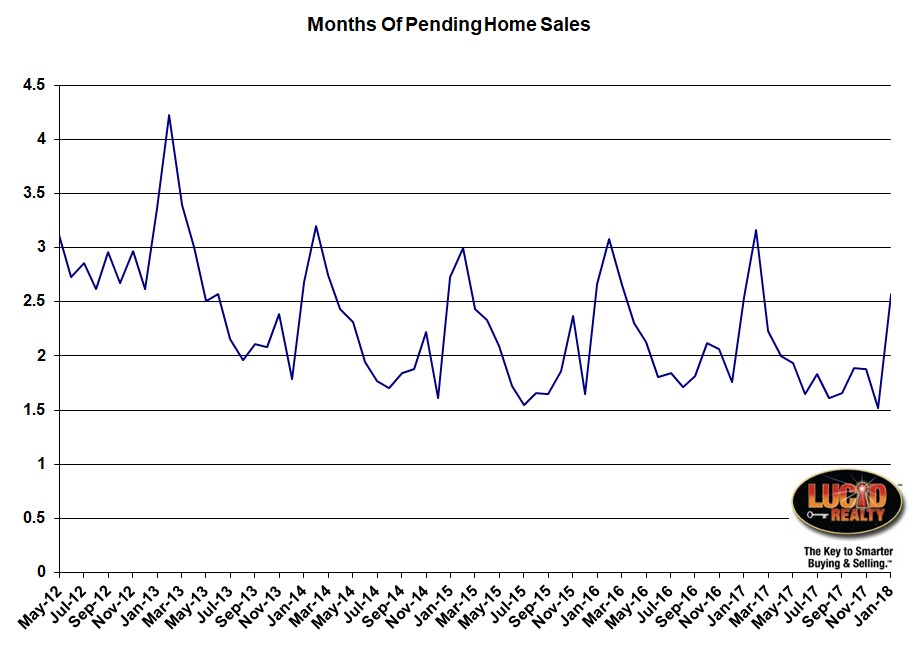
Pending Home Sales
I think pending home sales explains a lot of what has happened here to home sales in the last two months. Pending sales declined to a record low level at the end of December. Basically a lot of what went under contract closed faster than normal. Then January ended with a 2.55 month supply of pending home sales, which is actually up slightly from last year’s 2.54 month supply. In other words, closings slowed down or, another way to look at it, we rebuilt the backlog. Consequently, this reduced the closings in January but puts us in a slightly better position for February.
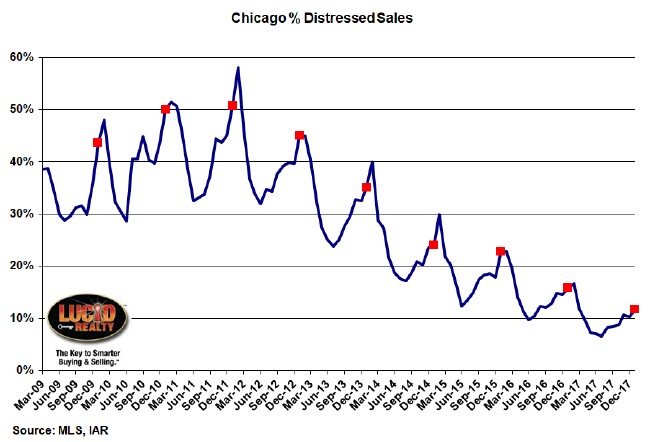
Distressed Home Sales
The decline in distressed home sales continues throughout Chicago with January at only 11.8% of sales, down from 15.9% last year. Given the trend we are on and seeing how we are close to a seasonal peak it’s possible that we will soon be under 10% – hopefully for good.
Chicago Home Inventory
I know this sounds like a broken record (they used to encode music in grooves on a vinyl disk, called a record, and if there was a scratch it could cause the record player to hit the same portion of a groove over and over again and repeat that part of the song) but Chicago’s home inventory is just ridiculously low. Detached inventory came down to just a 3.4 month supply from last year’s 4.4 month supply while attached (condos/ townhomes) inventory remained at an absurd 2.6 month supply. Once again, we suspect that the shortage of homes to buy is a key part of the reason that sales are so low.
Chicago Home Sale Market Times
The length of time required to sell a home is correspondingly low as shown in the graph below. Attached homes that sold did so in only 86 days which is down from 97 days last January. However, it’s odd that detached homes actually took longer to sell this January – up to 99 days from 92 days last January. It’s odd because you would think that significantly lower inventory of detached homes would drive down market times. Of course, it could just be that we are working through a backlog of long in the tooth listings.
You can also check out additional Chicago area real estate market data on my Web site that I update on a regular basis.
#RealEstate #ChicagoRealEstate
Gary Lucido is the President of Lucid Realty, the Chicago area’s full service discount real estate brokerage. If you want to keep up to date on the Chicago real estate market, get an insider’s view of the seamy underbelly of the real estate industry, or you just think he’s the next Kurt Vonnegut you can Subscribe to Getting Real by Email using the form below. Please be sure to verify your email address when you receive the verification notice.

