On Tuesday I reported on how the coronavirus is hitting the Chicago real estate market with a dramatic plunge in both contract and listing activity. What I didn’t go into at the time is whether or not this has created a buyer’s or seller’s market – i.e. how is the balance in the market? I didn’t go into it at the time because to discuss it properly I need to get a little geeky.
What I like to look at is inventory levels, for which there must be a dozen ways of calculating it. Looking at absolute numbers of homes for sale doesn’t tell you much because it’s only meaningful relative to how many buyers are out there. That’s why we like to look at months of supply – i.e. how long would it take to sell through the current inventory given some sales rate.
Well, it turns out there are probably half a dozen ways of doing that too. You can look at end of the month inventory or inventory available at some point during the month. You can also use either contracts or closings in the denominator and you can use either current month activity or an annual average. See what I mean? It gets pretty geeky.
Let me start by explaining that what I’ve been looking at in my monthly updates is months of supply based upon homes for sale and the average number of sales during the year. Notice that I didn’t define that very precisely. That’s because it comes out of a black box system for realtors which doesn’t define it very precisely. I’m trying to get more information and when I do I’ll come back and update this post. In the meantime, the important point is that it uses an average level of activity for the year and that means that the months of supply will be high in September and low in December when the number of homes for sale are high and low respectively.
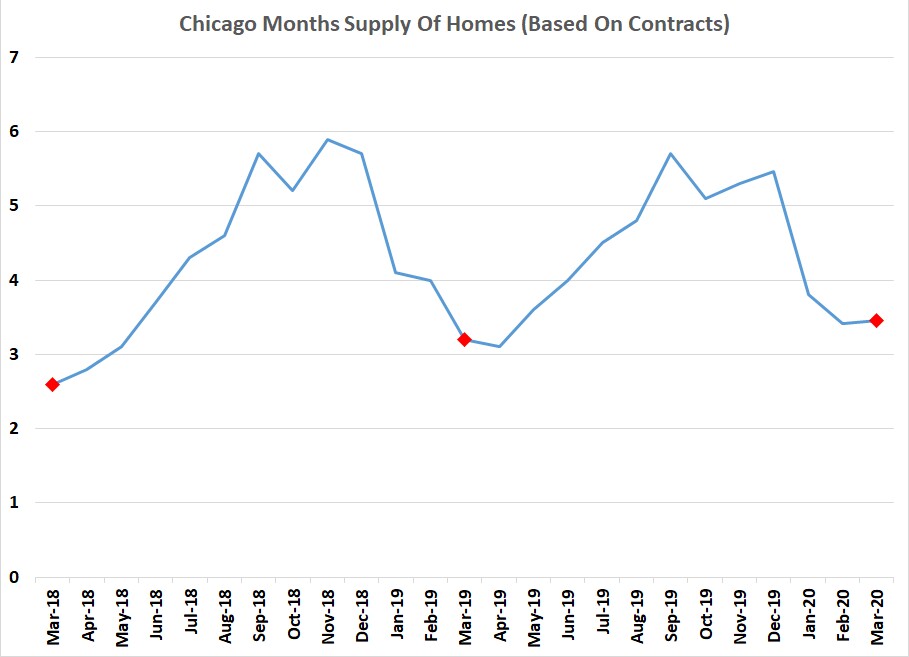
That may be intuitive but it’s actually better to base the months of supply on the level of activity for each month for which you are calculating the inventory level which better represents the supply/ demand balance at a moment in time. When you do that you actually get a graph that is shifted to the right by several months compared to what I normally show you. So the relative inventory low point is actually April instead of December.

You could justifiably ask why I don’t normally report the inventory this way. Honestly, the reason is that the system I use for this only goes back 2 years and doesn’t produce a graph. So it would be a lot more work for me to archive the data and manually create my graphs.
But what does all this mean for the impact of the coronavirus on the Chicago real estate market? Well, if you look at the graph above you’ll see that the March inventory level is indeed higher than it has been in the previous 2 years but not by much. More importantly, inventory was still way, way lower than it often is from September – December. So I would say that right now it’s still a seller’s market. Later this year, with an expected further decline in contracts and more homes on the market, probably not so much.
#RealEstate #ChicagoRealEstate #Coronavirus
Gary Lucido is the President of Lucid Realty, the Chicago area’s full service real estate brokerage that offers home buyer rebates and discount commissions. If you want to keep up to date on the Chicago real estate market or get an insider’s view of the seamy underbelly of the real estate industry you can Subscribe to Getting Real by Email using the form below. Please be sure to verify your email address when you receive the verification notice.