I’m thinking that every year I should look at how fast newly listed homes sell in Chicago. What better way to tell how the Chicago real estate market is doing? But this is not the simple market time analysis that is readily available through various databases. There are a couple of flaws with that approach: it’s an average and it typically only looks at homes that sold.
With regard to that latter point…yeah, you can’t talk about how fast a home sells if it hasn’t sold. But you can look at how long homes sit on the market without selling and how many get pulled from the market and when. To do this right though you need to give new listings a long enough time frame that market activity gets to play out. Hence, that’s why I will do this in August, using homes that were listed in late February/ early March. I’ve done this before and I always find it interesting.
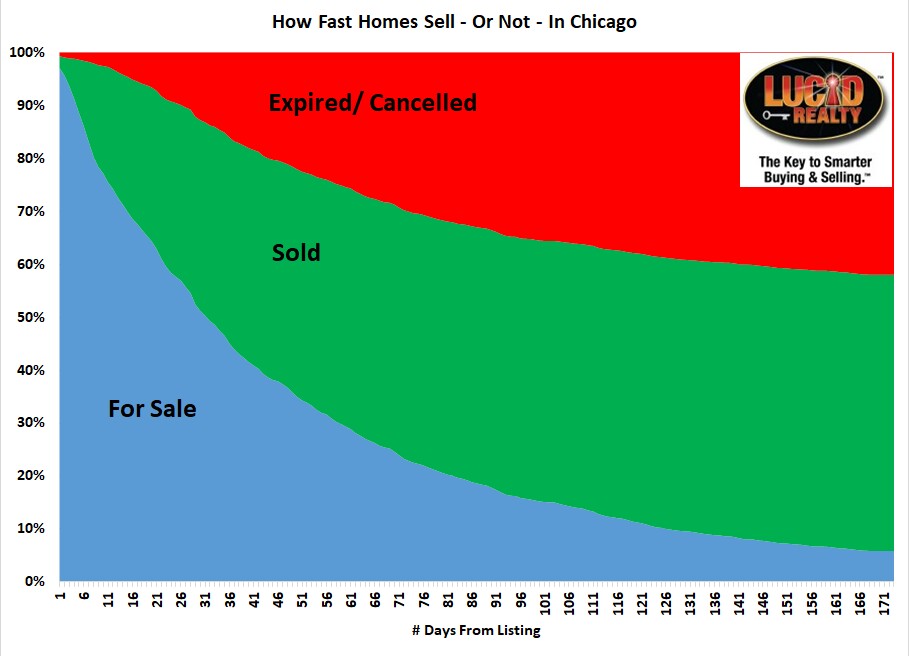
So, the graph below looks at 2892 homes (I can only pull 3000 from the MLS at a time) listed from February 25 – March 12 and the percentage of them that remain on the market, get sold, or get pulled at various points in time. Please note that the results of this analysis get confounded by a common practice whereby realtors – present company included – will relist a property that is not selling in order to give it additional visibility (it shows up as NEW in buyers’ searches). That means that some of those expired/ cancelled listings really didn’t get pulled from the market and some of the 2892 listings I am working with weren’t really new listings on day 1. Sorry but there is nothing I can do about this. Nevertheless, I think the results shown are directionally correct.
To summarize the results for you:
- 24.5% of the listings sell within the first two weeks. That’s pretty fast but it’s slower than last year when 30% sold in the first two weeks.
- 4% of the listings get pulled from the market in those same two weeks – similar to last year. I would bet a lot of those come back as new listings though because that’s pretty quick to give up.
- At the end of 30 days 36% have gone under contract and not quite 13% have been pulled from the market. Last year it was 41% selling within 30 days. So the market is definitely a bit slower this year, which is something we’ve seen in the average market time numbers.
- The analysis looks out 172 days or a little over 5 1/2 months. At the end of that time period 52% of the homes have sold, compared to 57% last year, and 42% have been pulled from the market, compared to only 37% last year.
- Note that last year was slower than 2 years prior when 64% sold by the end of the time period.
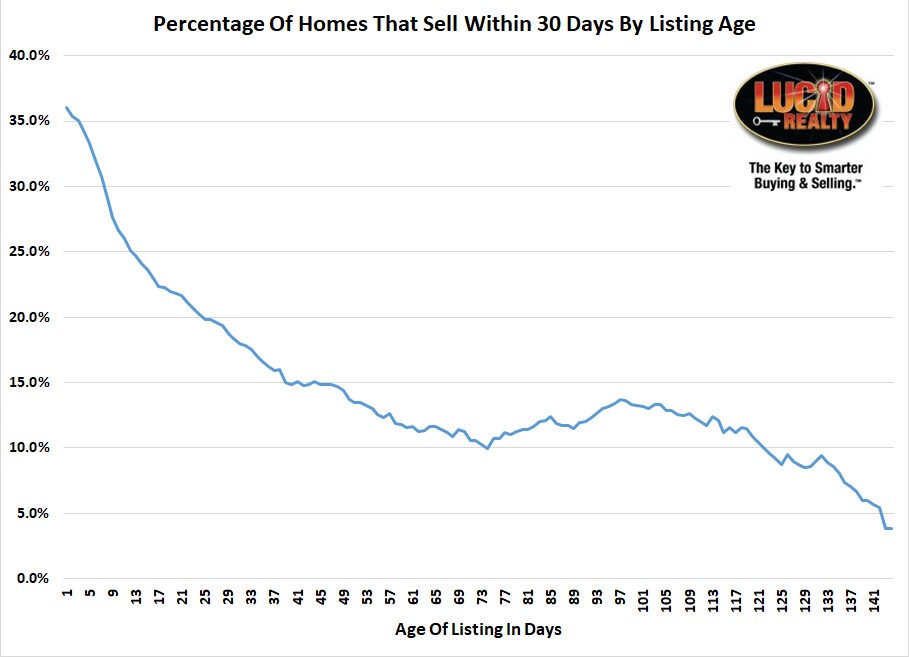
Last year I noted that the fact that the blue area flattens over time might suggest that older listings become less and less likely to sell as they age. It’s hard to just eyeball this though. It finally dawned on me this year that I can actually do the analysis and put some numbers on this. So, for each day I calculated the percentage of that day’s listings that sold over the next 30 day period and plotted that in the graph below.
As you can clearly see the percentage does indeed drop with age. As noted above, 36% of new listings sell within 30 days but only 18% of the listings that are still on the market at 30 days will sell within the next 30 days. This is totally consistent with what most realtors realize but sellers often don’t: the longer a home sits on the market the less likely it is to sell.
There are a few reasons why. First, the longer you’ve been on the market the more you have exhausted the existing buyer pool. Sure, new buyers are constantly entering the market but they may not be as ready to buy as the ones that have been kicking tires for a while. Also, the longer you’ve been on the market the more buyers are wondering what’s wrong with the place – i.e. why hasn’t anyone else bought it?
BTW, see the peculiarity in the graph below? After day 74 the probabilities actually go up and stay above the day 74 level until about day 122. How could that be? My theory – which I will check at some point – is that sellers start doing price reductions in that time frame.
#ChicagoHomeSales #ChicagoRealEstate
Gary Lucido is the President of Lucid Realty, the Chicago area’s full service real estate brokerage that offers home buyer rebates and discount commissions. If you want to keep up to date on the Chicago real estate market or get an insider’s view of the seamy underbelly of the real estate industry you can Subscribe to Getting Real by Email using the form below. Please be sure to verify your email address when you receive the verification notice.

