I should probably analyze how fast homes are selling at least once a year because it’s a great way to get a more in depth look at the overall health of the Chicago real estate market. The last time I did it was two years ago around this time of year: Chicago Real Estate Market: Just How Fast Have Homes Been Selling?
This approach is far more detailed and informative than simply looking at an average or median market time of homes that closed because it looks at how market times are distributed across an entire population of new listings. In addition, it doesn’t just look at homes that closed because it’s really important to understand how many homes are not selling and how long they are sitting on the market – and how many homes get pulled from the market as well.
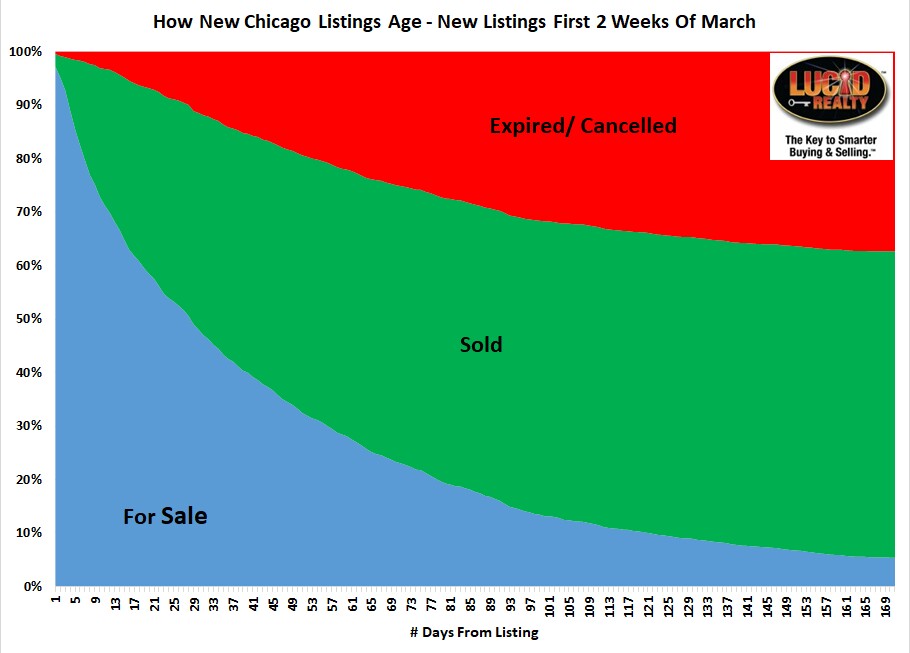
What I do in this analysis is take a cohort of homes listed in the last week/ first two weeks of February and March when Chicago’s real estate market is starting to really heat up – from February 26 – March 12 – and then follow what happened to them until yesterday. I summarize the results in the graph below (you can click on the graph for a larger version):
The visual pretty much tells the story but I’ll put some numbers behind it as well:
- In the first two weeks 30% of the listings have gone under contract – and pretty much ultimately close with these contracts.
- At the end of those two weeks not quite 5% of the listings have been pulled from the market. We don’t know what ultimately happened to them. Some of them may have been reactivated immediately under a new listing number.
- At the end of 30 days 41% have gone under contract and not quite 12% have been pulled from the market
- The furthest out time period we could analyze was 170 days or a little over 5 1/2 months. At the end of that time period 57% of the homes have gone under contract and 37% have been pulled from the market.
- Comparing this to my analysis from a couple of years ago it looks like more homes ultimately sold then than now – 64% vs. 57% now.
The way the blue area flattens as time goes on basically represents the probability that a home which hasn’t sold will sell. The fact that the blue area continues to decline means that homes continue to sell but the fact that it’s dropping so slowly indicates that the likelihood of a sale is also getting lower and lower.
Implications Of This Home Sale Market Time Analysis
One of the obvious questions that comes up when looking at how quickly homes sell is what are the controllable factors that can cause a home to sell quickly? Obviously, pricing a home lower will likely cause it to sell quickly but what impact does that have on the ultimate sales price? Some realtors claim that you can actually get a higher ultimate sales price that way?!?!?!? Or there is a fantasy about hiring a celebrity realtor whose pixie dust is going to get you a faster sale above list price (see those obnoxious HomeLight commercials).
The reality is that it’s impossible to draw any definitive conclusions on these claims. All we know is that homes that are priced lower sell faster and homes that sell quickly tend to sell closer to, if not above, their initial list price. Please note: THIS DOES NOT MEAN THAT THEY SOLD AT A HIGHER PRICE THAN OTHER HOMES THAT SOLD FARTHER FROM THEIR LIST PRICE. Quite possibly, and most likely, it just means that they were priced lower to begin with – i.e. closer to the market value and therefore the likely sale price. And that’s why they also sold faster and that’s how realtors can make their sales statistics look “good”.
As for the role of the realtor in all this….home sellers really sweat the decision as to what realtor to use to sell their home because they are desperately looking for pixie dust. But when 41% of homes go under contract in 30 days or less and 6% haven’t sold at the end of 5 1/2 months do you really think that pixie dust is a factor? It’s highly unlikely that it makes a difference at either end of the extreme. Like I always say, the only thing that matters is what a realtor is actually going to DO for you and how intelligent, responsive, and resourceful they are. Empty claims of great achievements are actually pretty worthless because it doesn’t tell you what you really need to know. A realtor could sell 100 homes in your neighborhood every year at 10% above list price within 1 week but that doesn’t do you any good if you can’t get them on the phone, they underprice all their listings, and they have a traditional commission structure.
#ChicagoHomeSales #ChicagoRealEstate
Gary Lucido is the President of Lucid Realty, the Chicago area’s full service discount real estate brokerage. If you want to keep up to date on the Chicago real estate market, get an insider’s view of the seamy underbelly of the real estate industry, or you just think he’s the next Kurt Vonnegut you can Subscribe to Getting Real by Email using the form below. Please be sure to verify your email address when you receive the verification notice.

