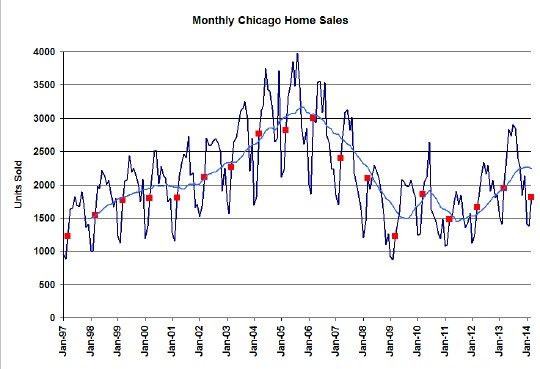
March just topped off the third month in a row of declining home sales in Chicago. Compare that to last year at this time when home sales were spiking by double digit percentage growth rates during the entire first quarter. I’m seeing a 4.4% decline in year over year sales for this March but when the Illinois Association of Realtors announces the official numbers in about 2 weeks their methodology will put the decline at around 6.9%. Of course, my number is more accurate.
In looking at the monthly home sales graph below you can see that the 12 month moving average is losing steam as expected and not only was March lower than last year but it was also lower than March 2010 – but that’s only because the government was artificially goosing the housing market with that dumb tax credit.
March’s home sales were on a par with the sales level of Chicago in 2000 and 2001.
The IAR will also extol the virtues of the incredible surge of median prices for March – up by almost 27% over last year. However, as I recently pointed out in another post, median home sale prices tell you nothing about home prices. For instance, I’ll leave you with this thought to ponder. While median home sale prices rose by 27% year over year the median sales prices of condos and townhomes rose only 4.4% and the median sales prices of single family homes actually declined by 1.5%.
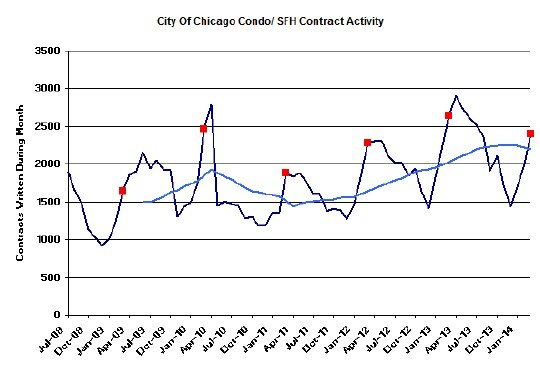
Chicago Home Contract Activity
Home sale contract activity in Chicago continues to point to further declines in sales and you can see it in the 12 month moving average in the graph below and in the fact that March was lower than last year by about 9.1%. If we’re not writing contracts then we won’t be selling homes. But March was still higher than 2009, 2011, and 2012.
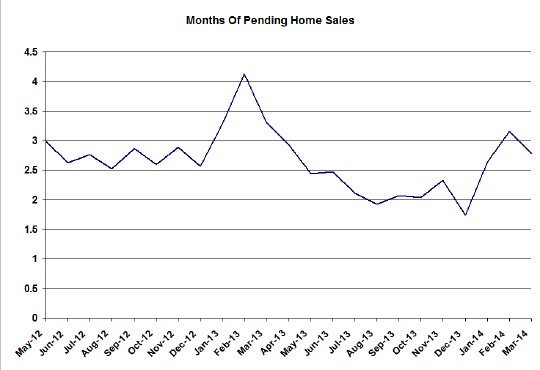
Pending Home Sales
And it’s not like we have a lot of pending home sales to feed closings for the next few months either. The graph below shows what is probably a brief seasonal peak that we are already coming out of – with only 2.8 months worth of closings to feed – significantly less than last year at this time when we had a 3.3 month supply.
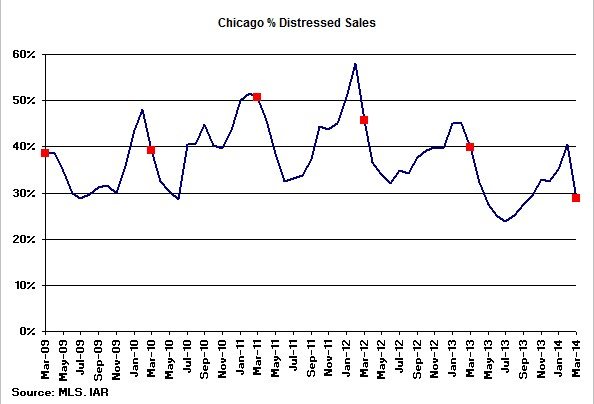
Distressed Home Sales
We’re also coming out of the normal seasonal peak of distressed home sales and the data shows that the percentage of distressed sales hit another all time low for this time of year since I’ve been tracking it – only 28.8%. This makes perfect sense as Chicago’s shadow inventory is running down and foreclosure activity is declining.
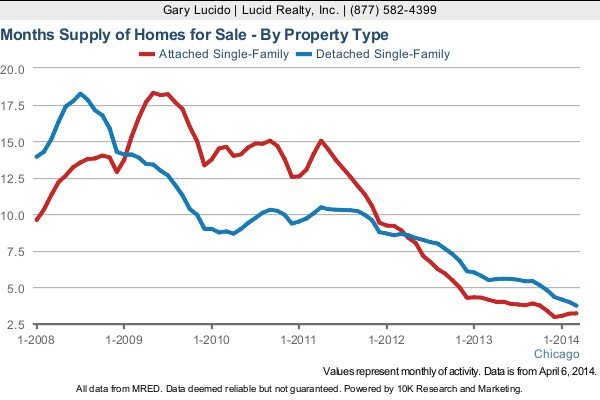
Chicago Home Inventory
It’s really important to look at Chicago’s decline in home sales in the context of it’s record low home inventory levels. Condo and townhome inventory did edge up slightly to a 3.2 month supply, while single family home inventory declined further to a 3.8 month supply. Both of these measures qualify for a “seller’s market”.
With such low inventories it’s not at all surprising that sales are down.
Chicago Home Sale Market Times
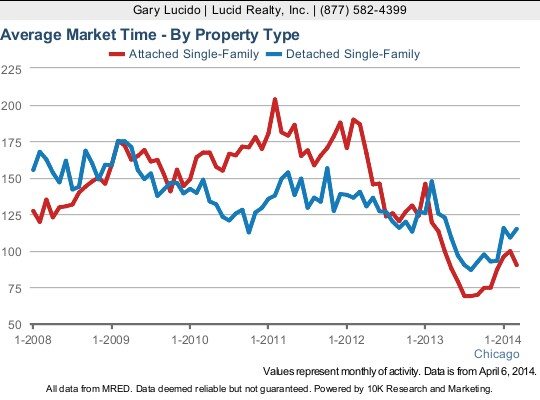
What remains peculiar is the fact that average market times have moved up over the last few months as shown in the graph below, though condo and townhome market times actually dropped in the last month to 90 days. The average market time for single family homes has now risen to 115 days. Neither of these averages is that bad but isn’t it a bit weird that market times are rising while inventories are so low? I still maintain that a lot of what is left in the market just isn’t that desirable.
If you want to keep up to date on the Chicago real estate market, get an insider’s view of the seamy underbelly of the real estate industry, or you just think I’m the next Kurt Vonnegut you can Subscribe to Getting Real by Email. Please be sure to verify your email address when you receive the verification notice.
