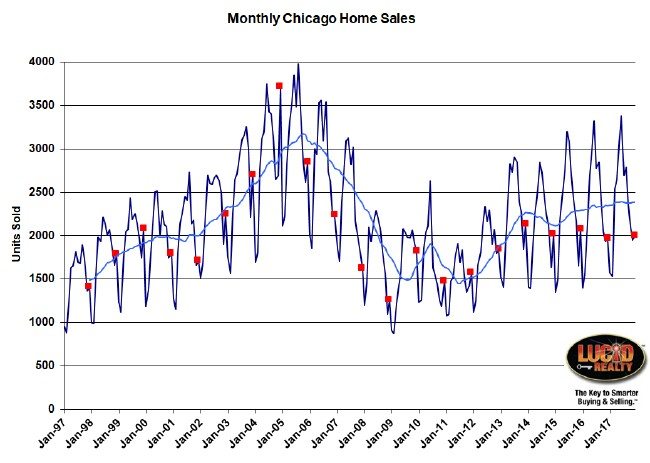
December home sales in Chicago came in 3.9% higher than last year. That’s the highest year over year growth posted for the Chicago real estate market in 9 months and sales were higher than 8 of the previous 10 years. 2013 (likely helped by some dumb government incentive program) and 2015 were stronger. You can see the long term history in the graph below and if you look at the light blue moving average line you can see that sales aren’t really growing that fast. I’ll address the cause below but it’s the same old story.
As is always the case, the Illinois Association of Realtors will report slightly lower growth in about 2 weeks – 1.8%.
Chicago Home Contract Activity
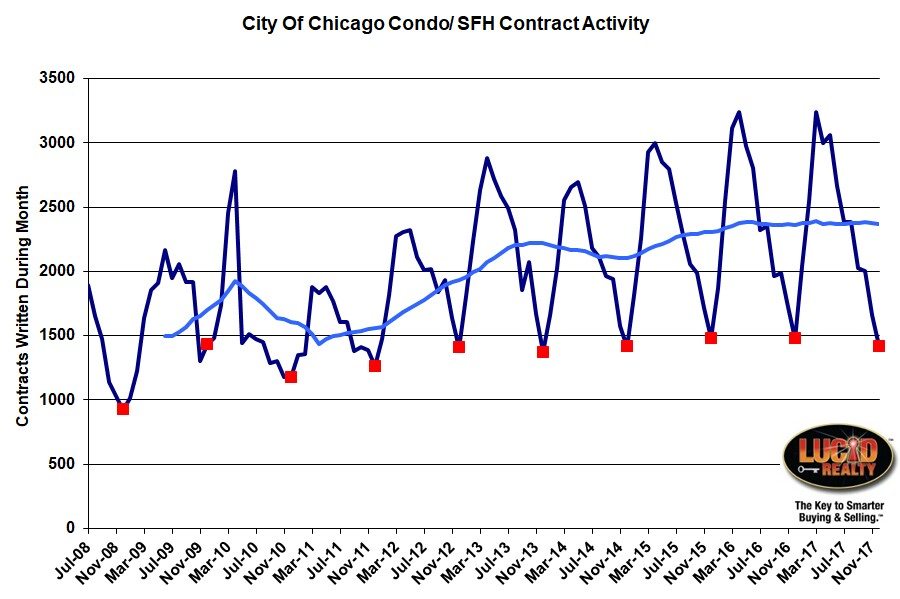
Looking at contracts written on homes gives us some idea of what the closings (sales) are going to look like for the next month or two. Unfortunately, contract activity has also been showing slow growth and has even been negative, as was the case in December: -4.1%. The graph below shows the history back to 2008 and once again the light blue moving average is pretty flat. Also, the red December markers really haven’t moved much in the last 6 years.
Pending Home Sales
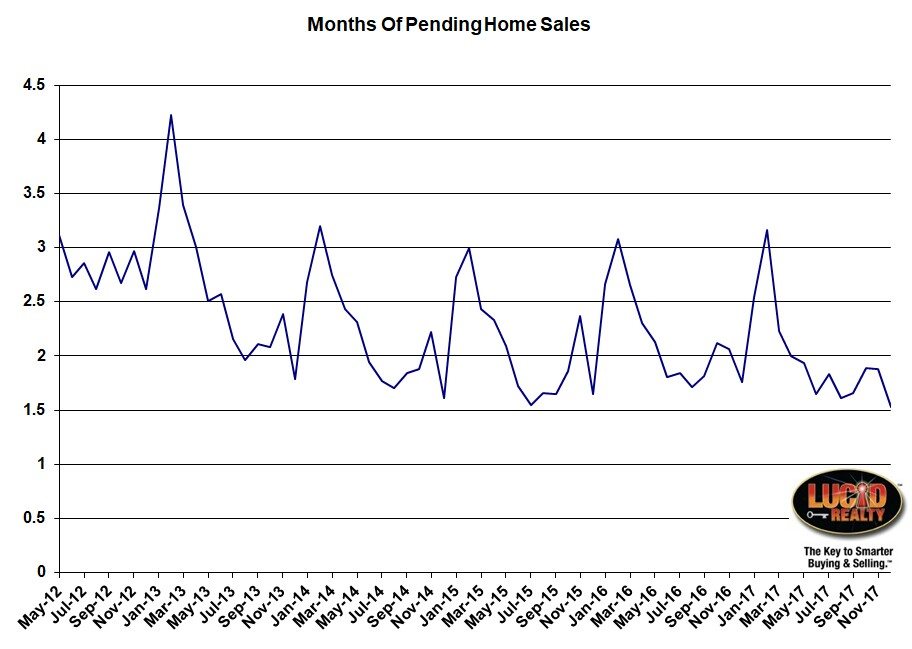
Pending home sales is another indicator of what sort of sales volume we are likely to see down the road and it’s also flashing red. On a months of supply basis December hit a new low of only 1.52 months, compared to 1.76 months last December. That’s a pretty significant drop and, not only does it indicate fewer closings going forward, but it also suggests that we got some of our December closings by drawing down this backlog.
Distressed Home Sales
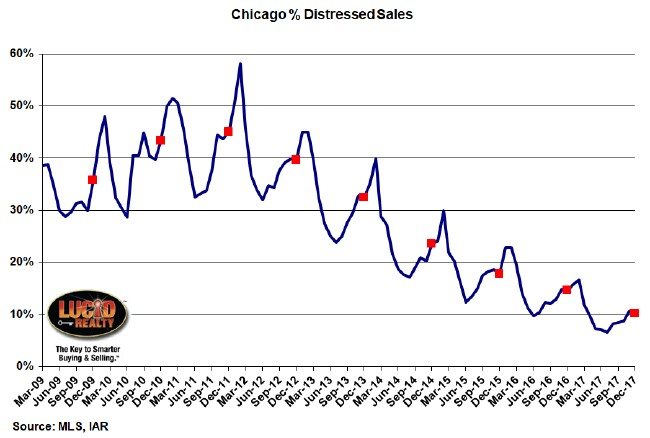
As has been the case now for 6 years, we hit another low in the percentage of Chicago home sales that are distressed. For December it was only 10.3% compared to 14.6% last year. I’ll be posting an update on Chicago foreclosures in a few days to shed additional light on this matter.
Chicago Home Inventory
The culprit in depressing home sales continues to be a shortage of homes to buy. Both attached (condos and townhomes) and detached homes remain at very low levels. There was only a 2.5 month supply of attached homes at the end of December, the same as last year. However, the supply of detached homes fell dramatically to a 3.4 month supply from 4.4 months last year.
Chicago Home Sale Market Times
Looking at just homes that sold, attached homes took on average 79 days to sell – the same as last year. However, it actually took longer for detached homes to sell than last year despite the lower inventory levels – 100 vs. 87 days. That is indeed an odd result that we have seen now for several months.
And you can see in the graph below that that these numbers rise at this time of the year as sellers hesitate to put fresh listings on the market that might otherwise sell faster.
I also maintain additional Chicago real estate market information on my Web site that I update on a regular basis.
#RealEstate #ChicagoRealEstate
Gary Lucido is the President of Lucid Realty, the Chicago area’s full service discount real estate brokerage. If you want to keep up to date on the Chicago real estate market, get an insider’s view of the seamy underbelly of the real estate industry, or you just think he’s the next Kurt Vonnegut you can Subscribe to Getting Real by Email using the form below. Please be sure to verify your email address when you receive the verification notice.


