Here is your preview of the Illinois Association of Realtors’ release in 2 weeks of November home sales for the city of Chicago: it was another stellar month with sales up by 26.6% over last year. That’s the 17th straight month of increases in home sales over the previous year – the last 9 of which have been double digit percentage increases.
November Home Sales In Chicago
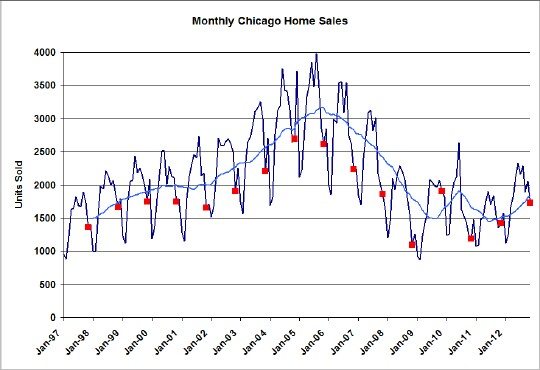
The graph below shows monthly home sales in Chicago going back to January 1997. All the November data points have been flagged in red for easy comparison and the light blue line represents a 12 month moving average that smooths out the considerable seasonality in the numbers. As you can see there is a clear pattern of the sales decline bottoming and this last November was the second best in the last 5 years. The only reason it wasn’t the best is because November, 2009 was distorted by government meddling in the housing market with their $8000 giveaway program.
Home Contract Activity
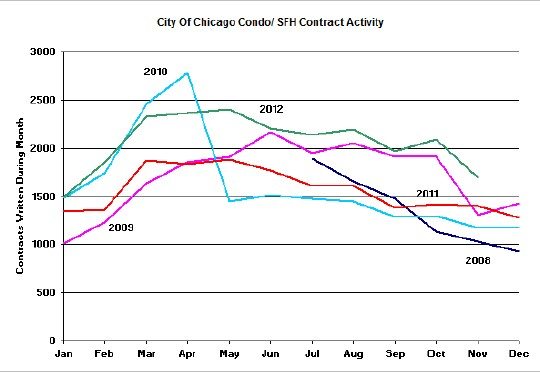
I’m going to have to change this graph soon because it’s getting too hard to read. But you can still see that Chicago home contract activity is at a 5 year high with contracts up 20.1% over last year. That’s 19 straight months of increases and it’s what’s fueling the sales gains above – with a 1 -3 month lag.
Since it takes a while for these contracts to close and you never know how long it will take I look at pending home sales for Chicago as well. Right now it’s sitting at 5191, which is enough to close 3 months worth of sales at November levels.
Home Inventory
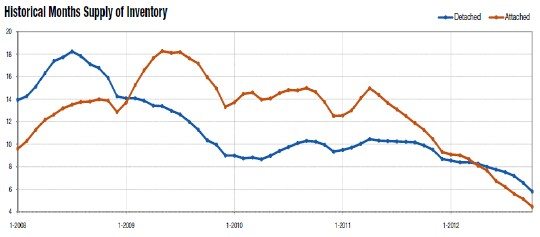
Ay, there’s the rub (I made that up). If you want to buy a home in Chicago right now good luck finding something decent. There’s just not much available. Home inventory, expressed as months of supply, is at the lowest level in 5 years. In fact, condos are in what is normally considered “seller’s market” territory with only 4.5 months of supply. Single family home inventory is also pretty low at 5.8 months. The chart below is courtesy of the Chicago Association of Realtors and is only current through October.
Distressed Property Sales
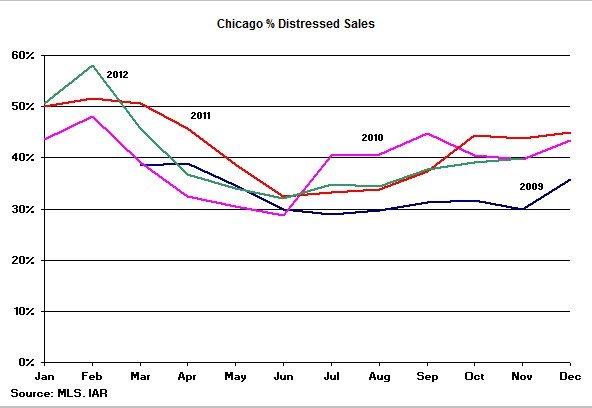
Well, apparently there are fewer distressed properties available for sale as well because the percentages of sales are not that high. They are right around where they have been for the last couple of years. November came in at 39.9%, below last year’s level. Where’s all that shadow inventory that we’re supposed to be afraid of?


