We’ve got the Illinois Association of Realtors January home sale report for Chicago coming up in a couple of weeks. What it will show is that January home sales were up a paltry 4.9% from January of last year – similar to the change we saw for December Chicago home sales. To put this number in historic perspective it’s 12% below January 2010 (with the “benefit” of government interference) but 18% above January 2009. But then you have to go back to 1998 to find a lower level of sales in January. In other words, Chicago home sales were only higher during the bubble years so we are at the new normal.
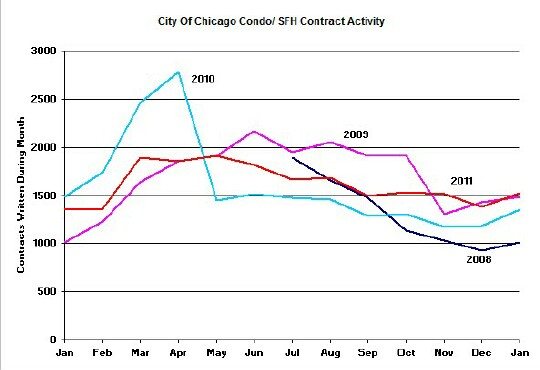
On the other hand Chicago contract activity continues to be much stronger, running 13%+ above the previous year for many months now. Check out the graph below (note: I’m using a 13 month calendar this month so that January can be seen in a historic perspective).
It’s a bit of a mystery how Chicago contract activity can remain so much stronger than home sale activity for such a long time and not be reflected in consistently higher sales numbers. Clearly a backlog is building and many of these contracts will never close. However, the numbers are of such a magnitude that it is interesting to say the least. At the end of January 2011 there were 2299 homes under contract in Chicago, all of which have either since closed or are still under contract – i.e. the contracts that fell apart over the last year are not included. However, as of the end of January 2012 there were 4377 homes under contract that have since either closed or are still under contract. Now clearly many of these contracts will fall apart over the next few months but this number is almost twice as big as the January 2011 number. Sure maybe 25% or even 30% of these will disappear but that still leaves a huge spread relative to the previous year. In other words at some point most of these will close and show up as a significant increase in home sales over the previous year.
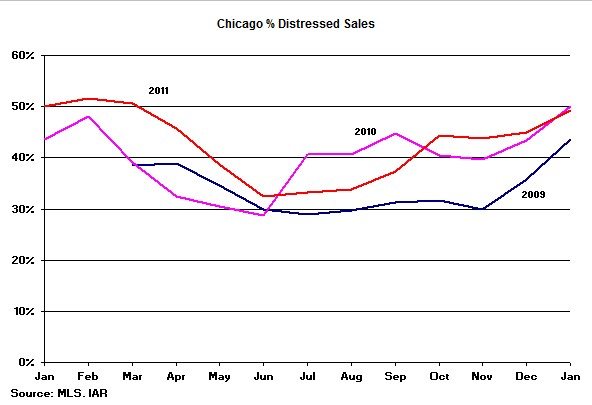
Distressed home sales continue to represent a huge percentage of total Chicago home sales – 49% in January – on par with last year. It’s the time of year when non-distressed sellers sit on the sidelines waiting for the spring selling season so more of what sells is distressed.
We maintain a collection of these and other statistics on our Chicago real estate market statistics page.

