As has been the case recently the Chicago housing market continued to sputter along in neutral in February, unable to keep up with last year’s torrid growth rate. February is coming in around 1.6% less than last year, which was up around 20% over 2012. And once again, in two weeks, the Illinois Association of Realtors will release numbers that look slightly worse – down 3.9%. This will be the second month in a row of home sales declines from the previous year but the declines are not that great. All of this is in line with my expectations based upon recent contract activity.
The February sales numbers are better than 4 of the last 5 years and are around the level we hit all the way back in February 2000.
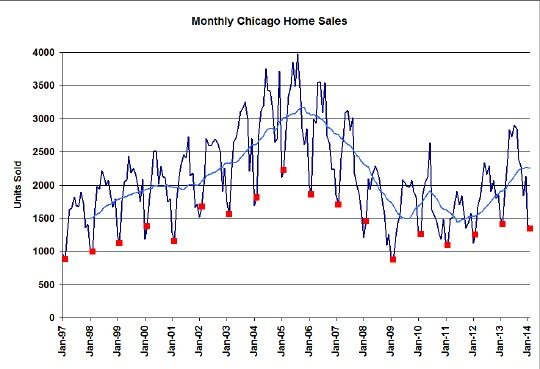
Meanwhile median home prices continue to rise, reflecting the increasing influence of higher end homes. The February median prices came in 12.2% higher than last year.
Chicago Home Contract Activity
Speaking of home contract activity, it’s getting weaker despite the fact that it was the second highest of the last 6 years. We saw a decline in this metric for the second time in a row. February was down 14.2% from last year, the biggest drop in 3 years. Nevertheless, as you can see in the graph below contract activity was still higher than 4 of the last 5 years.
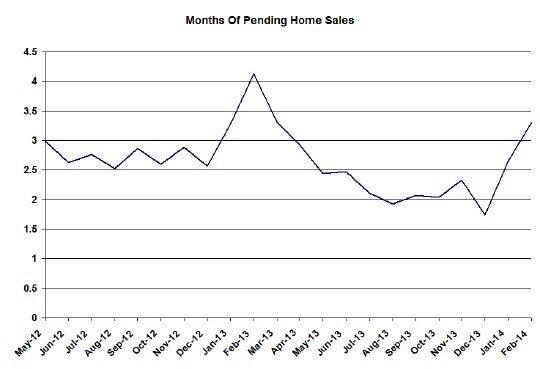
Pending Home Sales
Pending home sales recovered quite a bit, hitting a 3.2 months supply of contacts at current closing rates. But how is this possible with declining contract activity and essentially flat closings? We must have fewer contracts falling apart at this particular point in time, which is keeping more contracts alive at the end of the month.
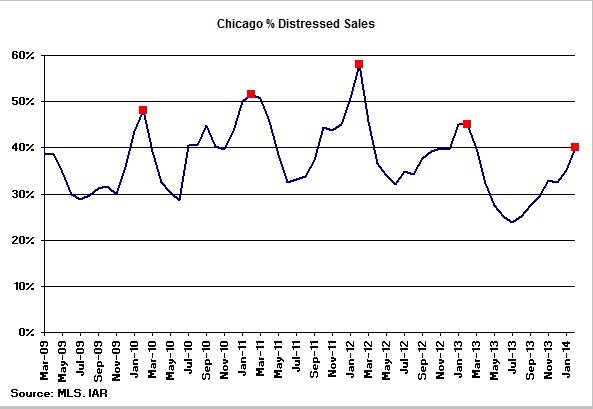
Distressed Home Sales
February is always a peak month in the percentage of homes sold that are distressed and last month was no exception. The reason is that at this time of year there isn’t a lot of normal inventory out there so the distressed properties dominate what little action is taking place. Nevertheless, as you can see in the graph below the percentage of distressed sales is the lowest it has been at this time of the year since I’ve been tracking it – 40%
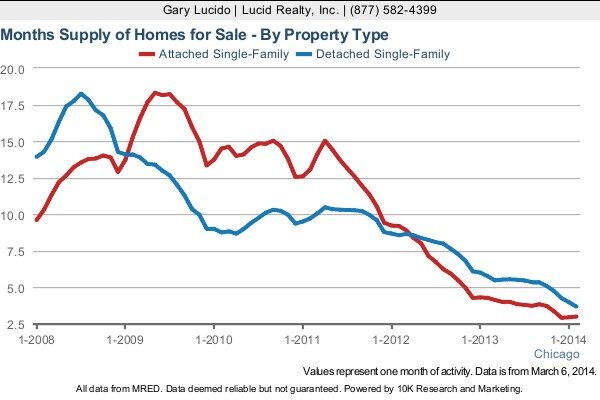
Chicago Home Inventory
The main story of the Chicago housing market remains the incredibly paltry levels of inventory. At the end of February we were down to a 3 month supply of condos and townhomes and a 3.7 month supply of single family homes. We continue to hit new lows each month, though there does seem to a flattening of the condo and townhome supply.
It’s these incredibly low inventory levels that must be driving the lower sales numbers but at the same time driving up home prices.
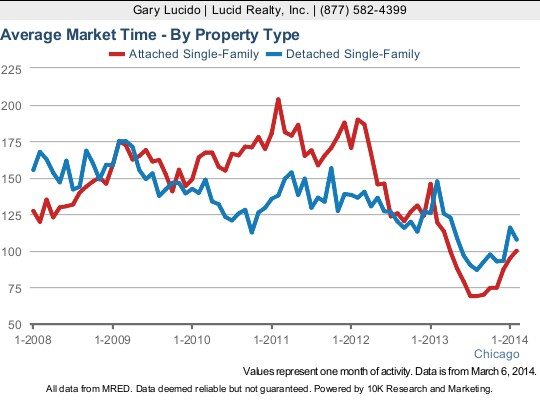
Chicago Home Sale Market Times
Looking at the average market times in the graph below we see how they have recently spiked dramatically after having steadily fallen over the last couple of years. Condos and townhomes that do sell are taking 100 days on average to sell while single family homes are taking 108 days. But with inventories so low the properties that are driving these longer market times must be somewhat undesirable.
If you want to keep up to date on the Chicago real estate market, get an insider’s view of the seamy underbelly of the real estate industry, or you just think I’m the next Kurt Vonnegut you can Subscribe to Getting Real by Email. Please be sure to verify your email address when you receive the verification notice.

