In 2 weeks the Illinois Association of Realtors will report that the Chicago housing market showed the highest sales growth in 2 years during July, with sales up 26.3% over the 2011 level. The only reason it wasn’t the best in more than 2 years is that in 2010 there was the government’s Cash For Shacks program that totally distorted the housing market (with absolutely no benefit but at great cost).
This is the 6th month in a row where the sales growth rate has steadily improved. What’s even more extraordinary is that this sales growth comes at a time when inventories are extremely low. More on that below.
July Home Sales For Chicago
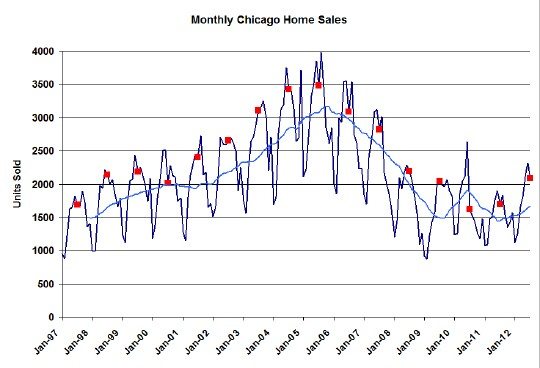
The graph below goes back to January 1997 and has all the July home sales numbers flagged in red for comparison. In addition, the light blue line shows the 12 month moving average, which smooths out the seasonal effects. As you can see last month had the highest sales level in 4 years and the moving average has turned decidedly positive.
Home Contract Activity
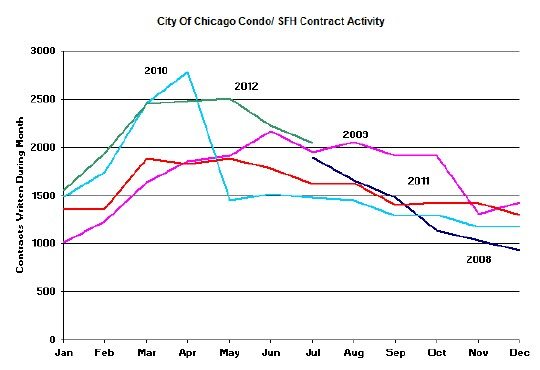
We track home contract activity as a leading indicator of the direction of home sales. When I originally posted on June’s contract activity last month at this time I was working with bad data (not my fault) and incorrectly concluded that Chicago’s real estate market was slowing down. Now that I have the right data it’s apparent that this is clearly not the case and both June and July showed strong double digit increases over the prior year – 25% and 27% respectively – putting contract activity at its highest level in 5 years.
One cautionary note on this measure: it is extremely imprecise because I have to estimate how many of these contracts will simply fall apart. However, most contracts fail in the first 4 months so it’s only the last 3 months that are estimated above.
We also look at pending home sales, which accounts for the difference between contracts written and deals closed. For July pending home sales in Chicago continued to decline to 5961 from 6139 in June (a decline at this time of year is normal). However, that’s still enough to fuel almost 3 months worth of closings.
Home Inventories
The extraordinarily low level of home inventory continues to be the big story. As you can see in the graph below the months of supply of homes for sale is at its lowest level in 5 years. So demand is up at a time when supply is down. Sure sounds ripe for price appreciation.
Distressed Property Sales
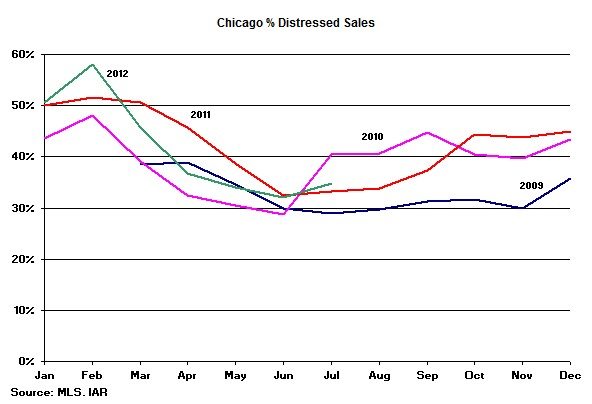
Distressed property sales accounted for 34.8% of Chicago’s total home sales in July, which is a little bit on the high side even for this time of year as you can see in the graph below.
We maintain a collection of these and other statistics on our Chicago real estate market statistics page.


