It was clearly big news today because it took me an entire hour before I could download the data from today’s release of the Case Shiller Home Price Index for October. The servers were totally overwhelmed. What the closely watched index of home prices for 20 cities, including Chicago, revealed was 13 out of 20 cities showed an acceleration in their year over year home price increases from the September release. Chicago was one of them. And the 20 city composite index registered it’s largest year over year increase since February 2006.
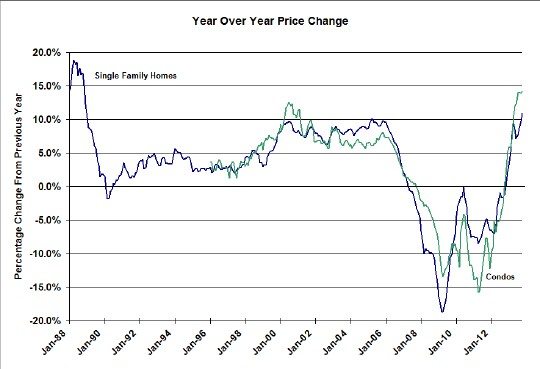
But the home price index for Chicago was most impressive, despite the fact that single family home prices actually declined from September. Let’s start with the year over year comparison since that’s the big headline today. Single family home prices were up 10.9% over last year – the biggest year over year increase in 25 years. Condominium prices were up 14.2% over last year, setting a new record in the 18 year old index (the condominium price index doesn’t go back as far as the single family home index).
With this latest release Chicago now joins the ranks of 15 other cities with double digit year over year single family home price increases – but we’re at the bottom of that elite group. Cities like LA, San Francisco, and Las Vegas are showing year over year increases in the 20%s.
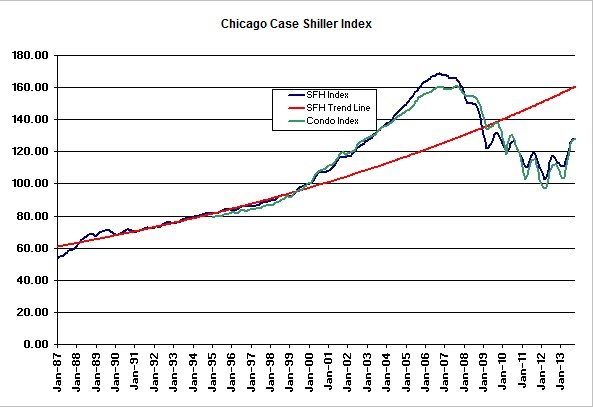
Stepping back now to look at the historical trend in the index for Chicago October single family home prices were actually down 0.5%, which is very good for this time of the year. Condominium prices were basically flat to last month. This takes single family home prices back to the level of February 2003 and condominium prices back to the level of November 2002. But this is still the highest level of Chicago home prices in 4 years for single family homes and 3 years for condos.
Single family home prices in Chicago have risen by 24% off the lows while condo prices have bounced back by 31.4%. But that’s still a loss of 24.4% in single family home prices from the bubble peak and a loss of 20.6% for condos. Single family home prices are tracking 20.7% below that red long term trend line in the graph below.
Commenting on the national home price picture, David Blitzer, Chairman of the Index Committee at S&P Dow Jones Indices, said:
Both Composites’ annual returns have been in double-digit territory since March 2013 and increasing; now up 13.6% in the year ending in October. However, monthly numbers show we are living on borrowed time and the boom is fading…
…The key economic question facing housing is the Fed’s future course to scale back quantitative easing and how this will affect mortgage rates. Other housing data paint a mixed picture suggesting that we may be close to the peak gains in prices. However, other economic data point to somewhat faster growth in the new year. Most forecasts for home prices point to single digit growth in 2014.
Personally, I think the picture for Chicago home prices is better than that, given that we have been lagging most of the other cities in the Case Shiller composite index. And I’m already seeing some good news for buyers. With all the talk of the housing market in Chicago recovering sellers are finally starting to peek their heads out of the sand. We might actually see some better supply over the next few months.
If you want to keep up to date on the Chicago real estate market, get an insider’s view of the seamy underbelly of the real estate industry, or you just think I’m the next Kurt Vonnegut you can Subscribe to Getting Real by Email. Please be sure to verify your email address when you receive the verification notice.