Finally we are seeing some real evidence of a turn in Chicago’s home prices and it’s not too surprising, given the tight inventory situation we are living with and the multiple offers we are seeing. The Case Shiller home price index just came out and it showed a 4.5% increase in single family home prices for the period March – May, with condo prices rising by 4.7%. That’s a huge number and in fact it was the largest increase among all 20 metro areas that Case Shiller reports on. But prices always increase at this time of the year so I decided to check the deseasonalized numbers and discovered that the 2.3% increase on that basis is the largest that Chicago has experienced since the numbers came out for February 1988. In other words that’s the biggest increase in 24 years.
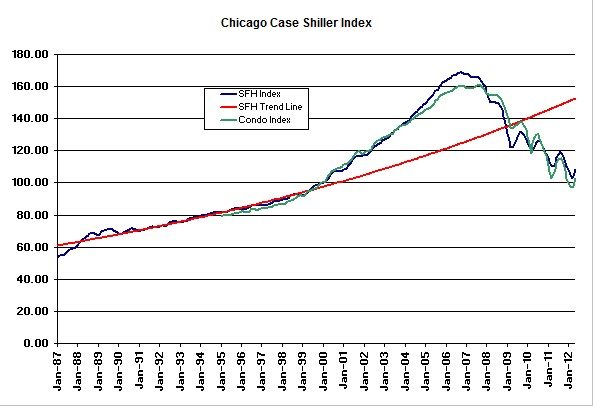
You can see the long term history in the graph below. We are in the midst of the 4th “bottom” since the housing bubble burst.

In Chicago single family home prices are still 35.6% below the bubble peak while condo home prices are 36.3% below the bubble peak. This puts single family home prices back to February 2001 levels and condo prices back to March 2000. Single family home prices are now running 28.8% below the red long term trend line in the graph above.
Commenting on the national numbers, David M. Blitzer, Chairman of the Index Committee at S&P Dow Jones Indices, said “The housing market seems to be stabilizing, but we are definitely in a wait-and-see mode for the next few months.” I don’t think anyone is willing to go out on a limb at this point and call yet another market bottom.
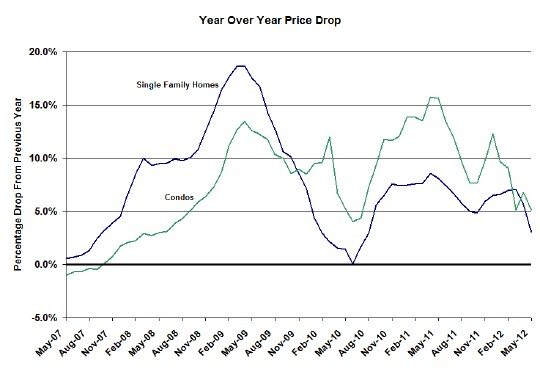
On a year over year basis home prices in Chicago have still declined – single family home prices are down 3.0% from last year and condo prices are down 5.1%. As the long term graph of year over year price declines shows prices have not risen over the previous year since May 2007 – just about when the bubble peaked. Maybe when we see prices increase from the previous year we will have a bit more confidence in the claim that the housing market has turned.
