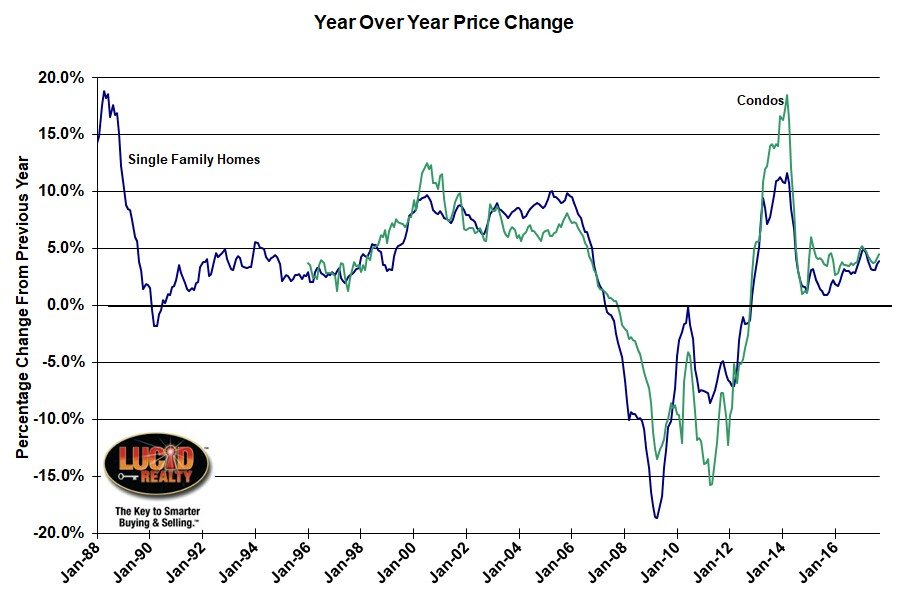
The Dow Jones S&P CoreLogic Case-Shiller home price indices for September came out this morning, showing national prices for single family homes rising 6.2% over the last 12 months. Chicago did register a 6 month high in year over year price gains – it’s 59th consecutive month of price gains – but at 3.9% we were still 2nd to last place among the 20 metro areas tracked. At least we are doing better than Washington DC, which only had a 3.1% increase, but it pales in comparison to #1 Seattle which had a 12.9% gain. That’s a good reason for Amazon to look elsewhere to expand.
Chicago condo prices rose 4.5% in the last 12 months, which was a 7 month high in that number. As you can see in the graph below condo prices have been consistently rising faster than single family home prices.

Home prices continued to rise across the country with the S&P CoreLogic Case-Shiller National Index rising at the fastest annual rate since June 2014. Home prices were higher in all 20 cities tracked by these indices compared to a year earlier; 16 cities saw annual price increases accelerate from last month. Strength continues to be concentrated in the west with Seattle, Las Vegas, San Diego and Portland seeing the largest gains. The smallest increases were in Atlanta, New York, Miami, Chicago and Washington. Eight cities have surpassed their pre-financial crisis peaks.
Most economic indicators suggest that home prices can see further gains. Rental rates and home prices are climbing, the rent-to-buy ratio remains stable, the average rate on a 30-year mortgage is still under 4%, and at a 3.8-month supply, the inventory of homes for sale is still low. The overall economy is growing with the unemployment rate at 4.1%, inflation at 2% and wages rising at 3% or more.
Case Shiller Chicago Area Home Price Index By Month
The graph below shows the monthly Chicago area home price indices for condos and single family homes – going back to January 1987 for single family homes. Single family home prices were flat in September vs. August while condo prices actually fell 0.2% as we move into the time of the year when such things happen.
As you can see the housing market in the Chicago area has improved quite a bit but still has a long way to go to get back to bubble peak pricing. Single family home prices are up 37.6% from the bottom but still 16.1% below peak values while condo prices are up 50.4% from the bottom and 9.1% below the peak.
I also like to compare current single family home prices to where prices would have been had they simply continued along the trajectory set prior to the bubble – the red line in the graph below. We are lagging that by 23.6% so area homes seem to be a relative bargain.
If you compare current home prices to the bubble period when they were higher you see that single family homes are still cheaper than they were during the entire period from May 2004 until November 2008 and condos are cheaper than they were from March 2005 through December 2008. So, on average, people who bought during those periods are still underwater.
#ChicagoHomePrices #CaseShiller
Gary Lucido is the President of Lucid Realty, the Chicago area’s full service discount real estate brokerage. If you want to keep up to date on the Chicago real estate market, get an insider’s view of the seamy underbelly of the real estate industry, or you just think he’s the next Kurt Vonnegut you can Subscribe to Getting Real by Email using the form below. Please be sure to verify your email address when you receive the verification notice.
