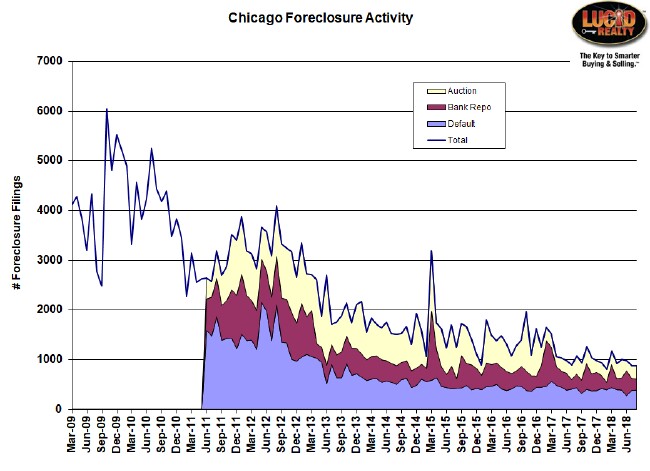
Attom Data Solutions/ RealtyTrac released their August Foreclosure Activity Report on Tuesday. Chicago foreclosure activity has been trending downward for quite a while and is near an all time low since I’ve been keeping track in the graph below. In fact, it was down 18.7% from a year ago. However, it does seem to have bottomed out a bit so I’m skeptical that it will go much lower.

At the national level foreclosure activity rose by 9% from July but fell 7% from a year ago. Because of the large month to month fluctuations in activity the year over year changes are more relevant. Both foreclosure starts and bank repossessions also showed increases from July but declines from last year.
Attom Data Solutions produced the graph below to show the country’s historical foreclosure activity but you won’t find it in the release. You can click on the graph for a larger version.
Chicago Shadow Inventory
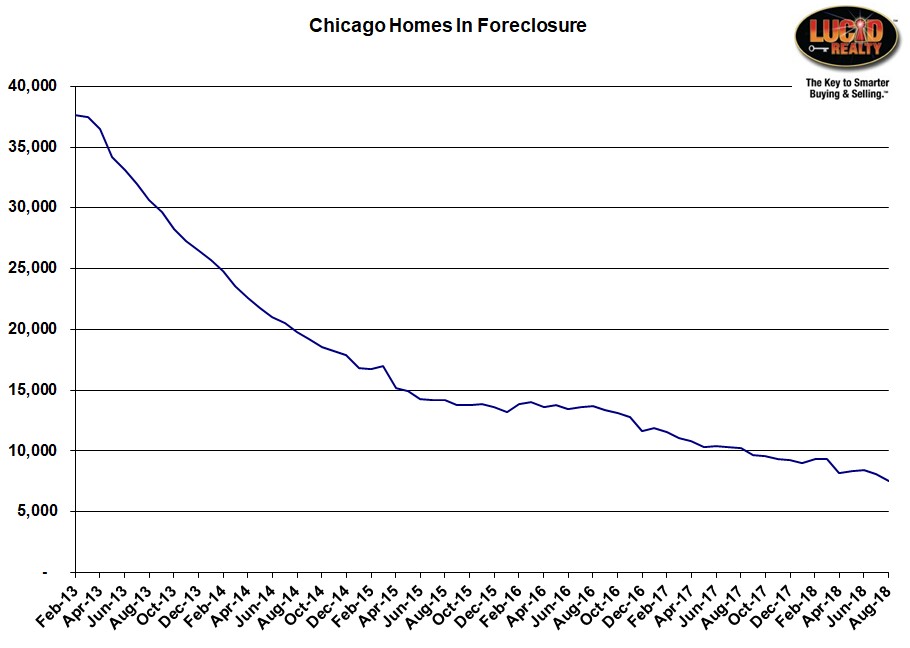
Probably the best indicator of how well Chicago is doing with its foreclosure problem is to look at the shadow inventory – homes at some stage of the foreclosure process. In August that number was 7548, down from July by 566 units, which is one of the larger drops we’ve seen. You can see where we are historically in the graph below. Obviously we keep hitting new lows since I’ve been tracking the numbers.
#ChicagoForeclosures #Foreclosures
Gary Lucido is the President of Lucid Realty, the Chicago area’s full service real estate brokerage that offers home buyer rebates and discount commissions. If you want to keep up to date on the Chicago real estate market, get an insider’s view of the seamy underbelly of the real estate industry, or you just think he’s the next Kurt Vonnegut you can Subscribe to Getting Real by Email using the form below. Please be sure to verify your email address when you receive the verification notice.

