What used to be the RealtyTrac foreclosure market reports now come out under Attom Data Solutions, which now owns RealtyTrac, and they typically only come out quarterly. The Q3 2017 U.S. Foreclosure Market Report™ was released last week and it highlights that the nation hit another 11 year low in foreclosure activity. This is really not a surprise since foreclosures have been on a steady decline since around 2010 as you can see in their graph below. In fact, US foreclosure activity is now below pre-recession levels.
Daren Blomquist, senior vice president at ATTOM Data Solutions, made some interesting observations about what is going on with foreclosures these days:
Legacy foreclosures from the high-risk loans originated between 2004 and 2008 have largely been cleared out of the distressed market pipeline. Meanwhile loans originated during the housing boom of the last five years are posting foreclosure rates below historic averages, with the notable exception of FHA loans originated in 2014, which have the highest foreclosure rate of any FHA loan vintage since 2009 — 29 percent above the historic average for FHA loans although still 55 percent below the peak in 2007.
Elevated foreclosure rates on 2014 vintage FHA loans reflect a gradual loosening of credit as the sustained housing boom is slowly bolstering confidence and increasing risk tolerance in the real estate market. This trend also explains increasing foreclosure starts in the third quarter in some of the nation’s hottest housing markets, counter to the national trend. If we see this pattern continue for 2015- and 2016-originated loans as those vintages age, we would expect to see a more widespread — although still relatively modest — lift in foreclosure activity in the next few years.
So what’s with those FHA loans from 2014? Hasn’t the government learned anything? Well, it seems like they ultimately did get their act together because the FHA foreclosure rates on loans originated after 2014 has improved substantially. However, it is concerning that default rates (and not just for FHA loans) are rising in some of the hottest markets.
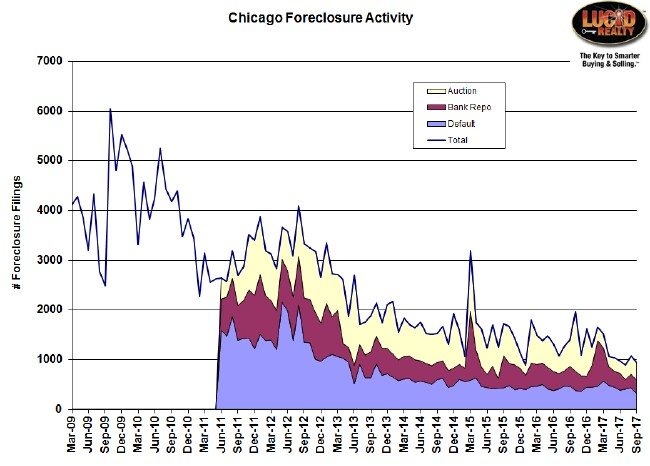
But what does all this mean for Chicago foreclosures? I’ve updated my graph below and it shows us puttering along at fairly low levels. What is most impressive though is that we just hit a new low in defaults. That’s exceptionally good news because those are the first step in the foreclosure process and if those are declining then that means we are going to have fewer foreclosures for some time to come.
Chicago Shadow Inventory
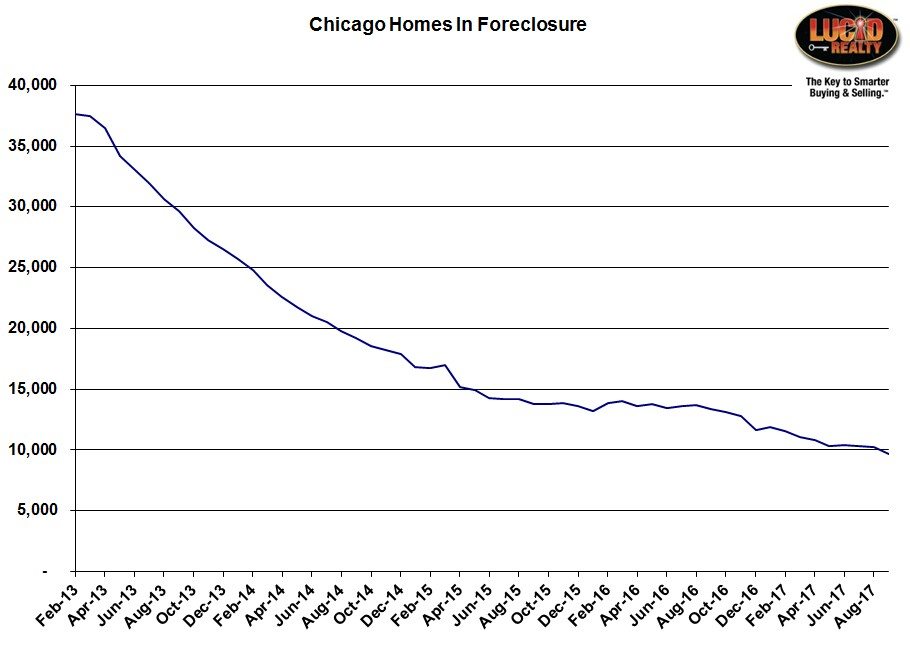
More importantly, the number of Chicago homes IN foreclosure also just hit a new low, finally breaking through the 10,000 level with the largest drop since December. Check out the graph below for the historic perspective. With this ever decreasing shadow inventory it’s no wonder that foreclosure sales as a percentage of the total continues to reach new lows, which is great news.
However, one of the drivers of shadow inventory is how long it takes to complete a foreclosure, which is in turn driven by all the rigamarole you have to go through to get one done. Nationwide it’s taking longer and longer to complete the foreclosure process and Illinois is in the top 5 states at 1087 days. This is really not a ranking you want to win.

Gary Lucido is the President of Lucid Realty, the Chicago area’s full service discount real estate brokerage. If you want to keep up to date on the Chicago real estate market, get an insider’s view of the seamy underbelly of the real estate industry, or you just think he’s the next Kurt Vonnegut you can Subscribe to Getting Real by Email using the form below. Please be sure to verify your email address when you receive the verification notice.

