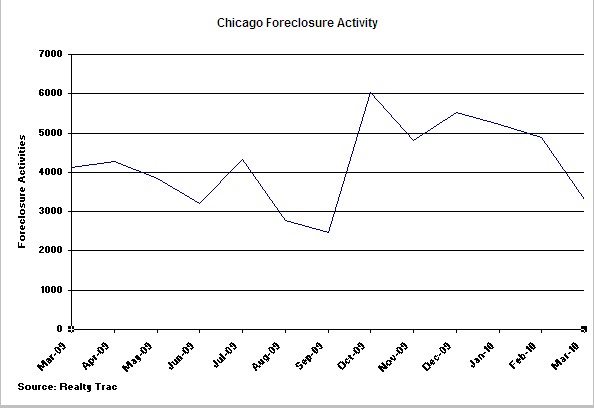
If you are following the foreclosure news in the mainstream media (see Crain’s) you will hear about how foreclosure filings in Illinois were up 17.5% in the first quarter over last year. However, when you look at RealtyTrac’s March foreclosure numbers for just Chicago the picture is a bit better. They were actually down 19% vs. last year.
I don’t have enough data yet to determine if there is really a seasonal effect here so I don’t know if year over year comparisons are that relevant. The data looks pretty volatile so I’m also not sure if the fluctuations we are seeing are meaningful either.
The new HAFA program may actually reduce the number of foreclosures while increasing the number of short sales going forward. I’m betting that that will put less pressure on home prices.
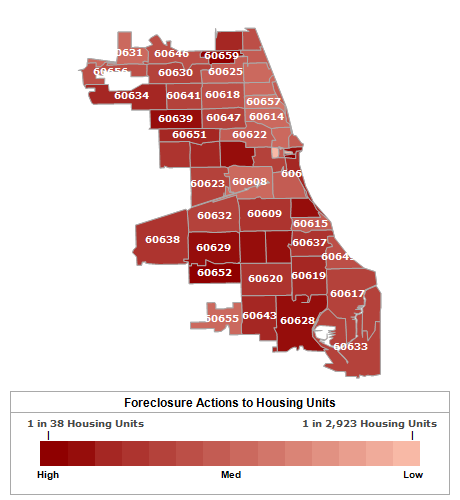
You should also check out RealtyTrac’s nifty little interactive Chicago foreclosure heat map that shows the foreclosure reate in Chicago by zip code.
As a point of reference, RealtyTrac shows 1 in every 360 housing units in Chicago receiving a foreclosure notice in March – that’s on average. Interestingly, in March the foreclosure activity was much higher in some of the downtown areas than in February. Zip codes 60603 and 60604 had rates at the highest end of the spectrum, but apparently that is based upon some really small numbers since there are not a lot of homes in those areas. More significantly, zip code 60601 had 1 filing per 239 homes, while 60605 (South Loop no surprise) had 1 filing per 277 homes, both of which are above the average.

