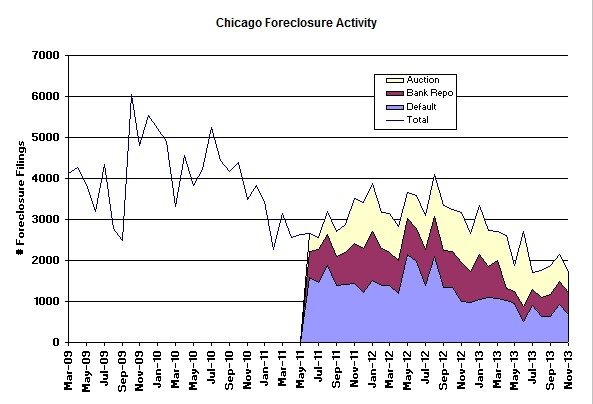
Several research reports were released in the last few days that provide some insights into where we stand with respect to Chicago’s and the nation’s foreclosure problem. Today RealtyTrac released their November Foreclosure Market Report and the data provided for Chicago remains consistent with my headline from last month’s post on this topic. Namely, Chicago’s foreclosure activity appears to have bottomed for now. November activity was actually a bit higher than July’s low.
Commenting on the November decrease at the national level, Daren Blomquist, vice president at RealtyTrac, sounded an optimistic note:
While some of the decrease in November can be attributed to seasonality, the depth and breadth of the decrease provides strong evidence that we are entering the ninth inning of this foreclosure crisis with the outcome all but guaranteed. While foreclosures will likely continue to stage a weak rally in certain markets next year as the last of the distress left over from the Great Recession is dealt with, it is highly unlikely that there will be a foreclosure comeback that poses any major threat to the solid housing recovery that has now taken hold.
However, Chicago continues to take top honors in RealtyTrac’s foreclosure market report as the metro area with the third highest foreclosure rate in the country. CoreLogic also released a foreclosure report that showed that through the end of October the foreclosure inventory (homes in the foreclosure process) in the Chicago metro area was 3.9% of all mortgages outstanding and that 7.9% of all the mortgages were in serious delinquency. That compares to national averages of 2.2% and 5.1% respectively.
Chicago Shadow Inventory
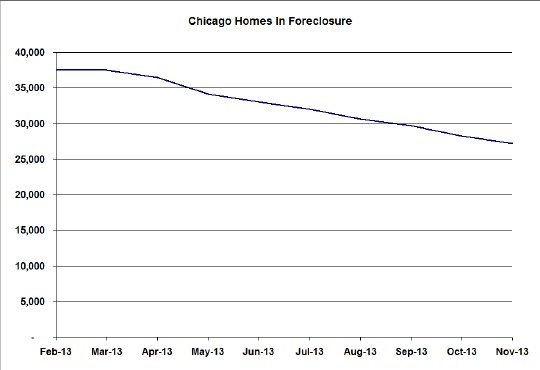
The good news/ bad news story is that Chicago’s shadow inventory (homes in foreclosure whether or not they are on the market) continues to decline at about 1,000 units per month. From the current level of 27,239 that means we have at least another 27 months to go before we blow through all this. In reality, there is always going to be some shadow inventory out there so sooner or later the rate of decline is going to slow down.
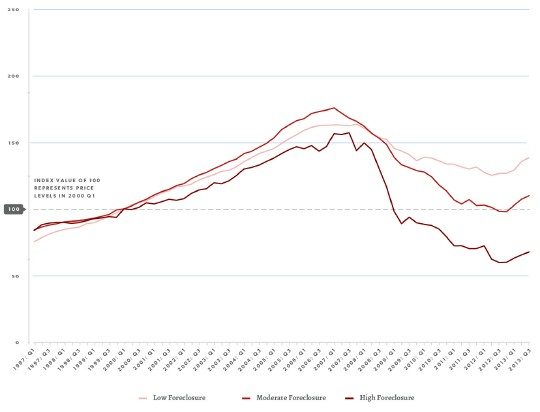
And then Depaul University’s Institute For Housing Studies came out with their third quarter house price index for Cook County and it had some interesting data on the impact of foreclosures on home prices in Cook County. They produced the graph below that shows separate price trends for low, moderate, and high foreclosure neighborhoods. It’s hard to read but the vertical axis represents the index values in increments of 50, with 100 flagged and corresponding to home values at the beginning of 2000. As you might expect, the higher the foreclosure activity the larger the dip in prices during the bubble bust and the more those neighborhoods are lagging now in price appreciation. In total these neighborhoods now stand below their bubble peak pricing by the following amounts:
- Low foreclosure activity neighborhoods: -15.4%
- Medium foreclosure activity neighborhoods: -37.5%
- High foreclosure activity neighborhoods: -57.1%
However, the higher foreclosure activity neighborhoods have recently shown the highest year over year price appreciation. So maybe these neighborhoods can eventually catch up?
If you want to keep up to date on the Chicago real estate market, get an insider’s view of the seamy underbelly of the real estate industry, or you just think I’m the next Kurt Vonnegut you can Subscribe to Getting Real by Email. Please be sure to verify your email address when you receive the verification notice.


