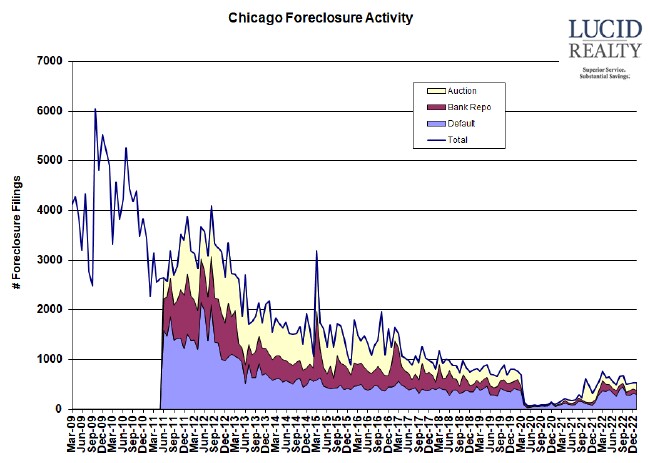
Earlier this month ATTOM released their January Foreclosure Market Report which continued to highlight the recent trend of substantial percentage increases in foreclosure activity from the previous year. However, a year ago we were coming out of the pandemic foreclosure moratorium so the activity level was still depressed and that makes the current activity look worse than it really is. If you look closely at the graph of Chicago foreclosure activity below you’ll see that we continue to run at levels below where we were pre-pandemic. So there’s really nothing to worry about.

As usual Illinois had the second highest foreclosure rate among states and the Chicago metro area had the highest rate among major metro areas.
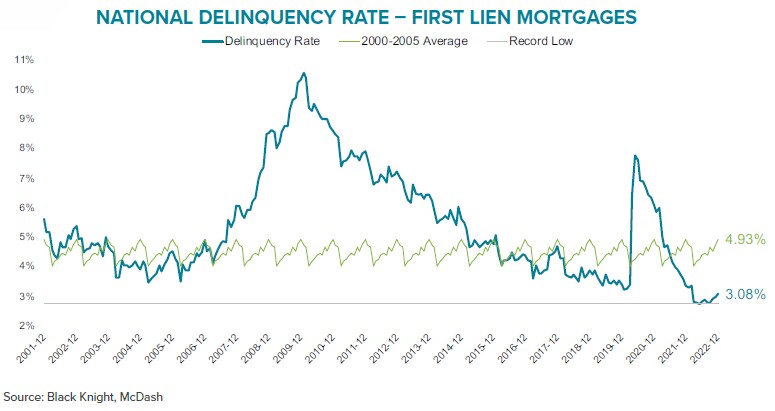
We also continue to get good news from Black Knight’s Mortgage Monitor Reports. The graph below comes from the December report and highlights just how low the national delinquency rate has been running. Despite the fact that it has recently ticked up ever so slightly 3.08% is near a historic low and that suggests that few homeowners should be entering foreclosure.

Chicago Shadow Inventory
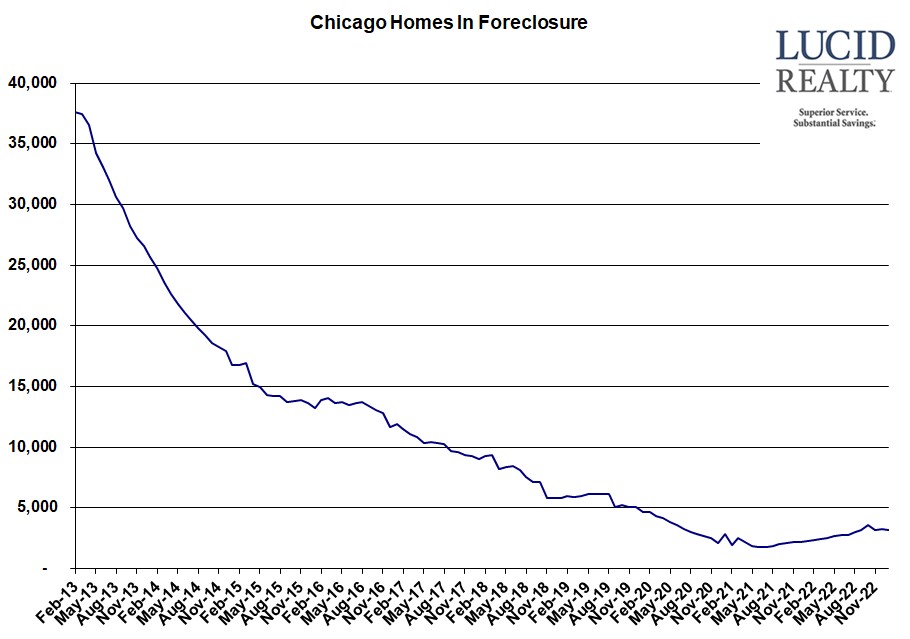
Despite the fact that Chicago’s foreclosure activity has been running so low there has been a noticeable uptick over the last year or so in the number of homes that are in foreclosure. It seems almost impossible that that could happen but at least it now looks like that trend has flattened out over the last few months. My theory continues to be that we just had to refill the pipeline after the foreclosure moratorium and I suspect that it’s not really going to get any worse from this point on.

