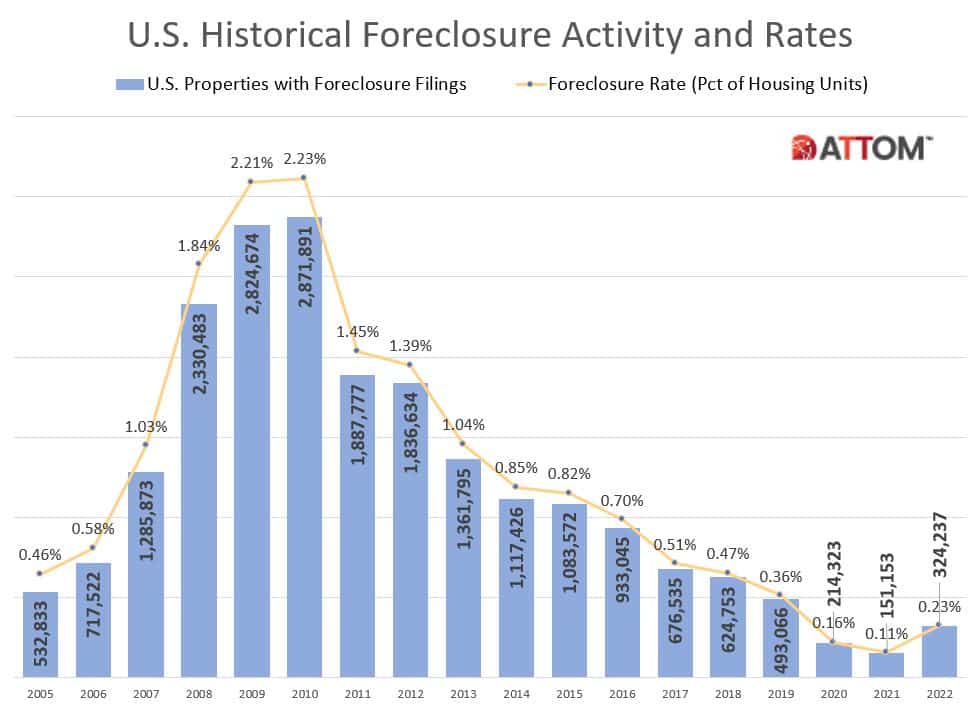
On Thursday ATTOM released their Year-End 2022 U.S. Foreclosure Market Report and also provided data on Chicago foreclosure activity. Their graph below shows how the nation’s foreclosure activity in 2022 more than doubled from 2021 but remains below pre-pandemic levels – down 34% from 2019 to be exact.
Rick Sharga, executive vice president of market intelligence at ATTOM, credits the efforts of the government and the mortgage industry, along with a good economy, for averting what could have been a disaster as a result of the pandemic. But, as I’ve pointed out before, he also goes on to say:
Our recent homeowner equity report shows that 93 percent of borrowers in foreclosure today have positive equity, which they appear to be leveraging in order to avoid a foreclosure by refinancing their mortgage or selling the property at a profit.
So there might be a slight uptick in foreclosure activity as homes enter the foreclosure process but then these homes will exit the foreclosure process on their own before the final stages and not at distressed prices. So overall foreclosure activity won’t be that elevated nor will there be that much pricing pressure on the real estate market.
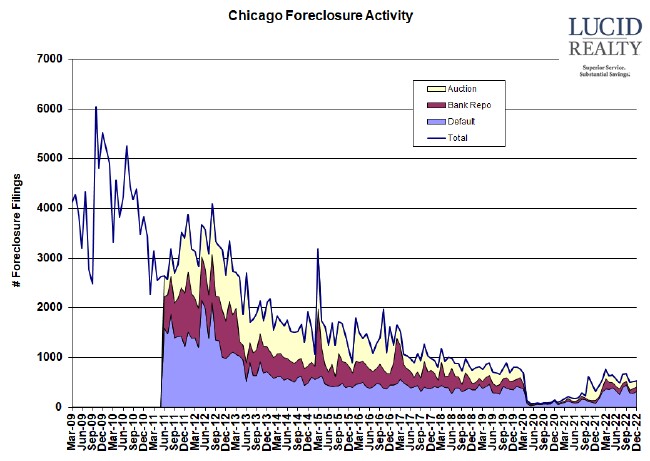
I’ve graphed the monthly data for Chicago foreclosure activity below and it pretty much tells the same story. In fact, on a monthly basis the activity is flat to declining. And, repeating a long standing pattern, both Illinois and Chicago were highlighted as having the highest foreclosure rates among states and large metropolitan areas respectively.
Another factor keeping a lid on foreclosures is the relatively low delinquency rate that we’ve been observing. I get this information from Black Knight’s monthly mortgage monitor report but they didn’t produce a graph for November because of the holidays. However, they did report a slight uptick in the delinquency rate to 3.01%, which is still extremely low compared to historical levels.
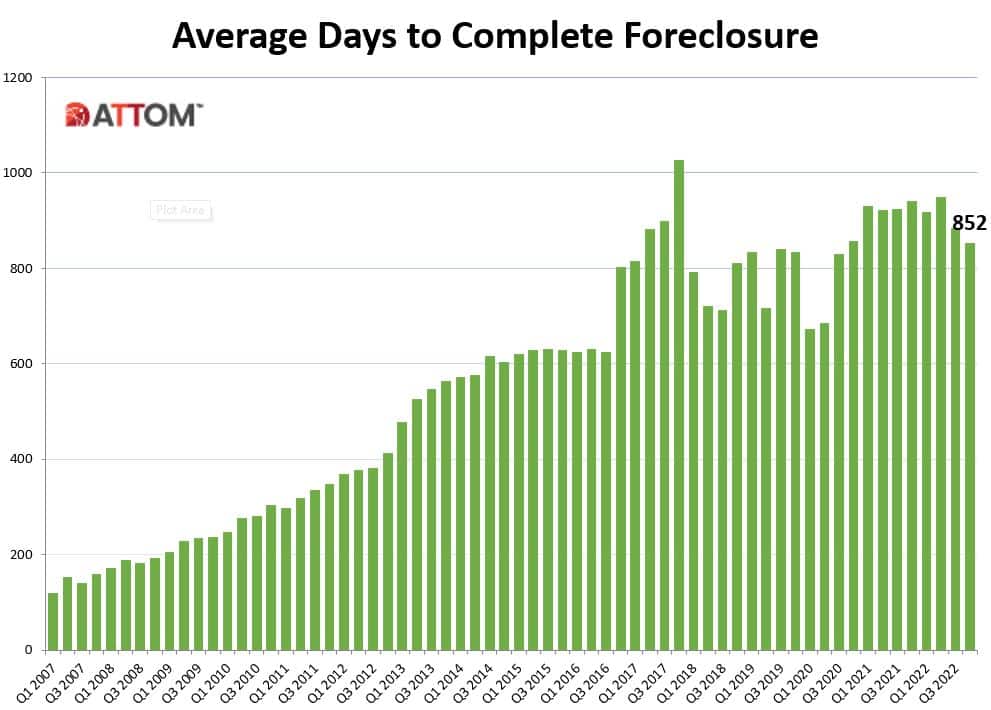
In other news…the time required to complete a foreclosure remains absurdly high but it did decline slightly in the 4th quarter.
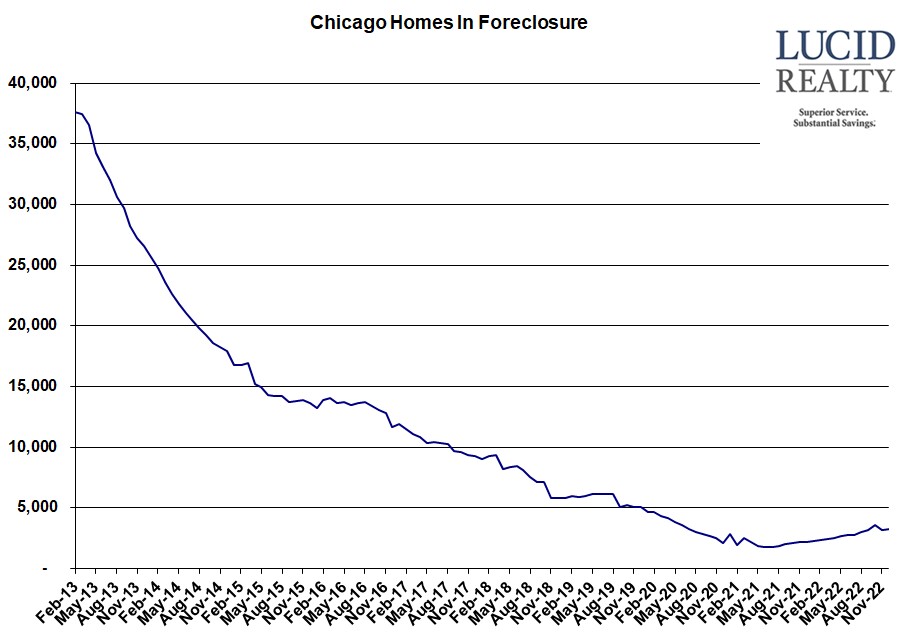
Chicago Shadow Inventory
Ultimately, what really matters to the Chicago real estate market is the number of homes that are in some stage of foreclosure because these represent a shadow inventory that could hit the market at any time. In the graph below you can clearly see an increase over the last year or so as the foreclosure moratorium ended. However, this inventory is beginning to look like it may have peaked at a level that is still relatively low on a historic basis.
