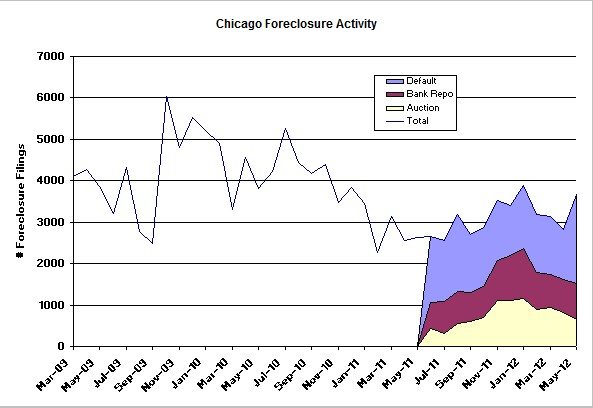
RealtyTrac came out with their May foreclosure activity report for Chicago and the nation last week (I’ve been really busy) and it shows a 30% spike from April after 3 months of declines. And if you look at the graph below you can see that over the last year there is a slight upward trend. However, overall activity is still lower than it has been over the last couple of years.
The big increase in May was in notices of default, which were up a whopping 79% from April!
At the national level overall foreclosure activity was up 9% from April, which is the first nationwide increase in 28 months according to the RealtyTrac blog. According to Brandon Moore, CEO of RealtyTrac:
…the jump in May foreclosure starts shows that it’s going to be a bumpy ride down to the bottom of this foreclosure cycle. Based on the rise in pre-foreclosure sales we’ve seen so far this year, a higher percentage of these new foreclosure starts will likely end up as short sales or auction sales to third parties rather than bank repossessions going forward. While pre-foreclosure sales have less of a negative impact on home values than bank-owned sales, they still represent a discounted sale where a distressed homeowner is losing his or her home.
Brandon Moore goes on to say something that I totally disagree with because he is misinterpreting the data:
Disposing of distressed homes by pre-foreclosure sale can also benefit lenders and servicers because pre-foreclosure homes sell at a higher average price point than bank-owned homes. Our first quarter foreclosure sales report showed that the average price of a pre-foreclosure home was more than $27,000 higher than the average price of a bank-owned home — which quickly adds up given that there have been an average of 1.6 million nationwide foreclosure starts per year for the past five years.
The problem with this statement is that just because the average selling price of a pool of short sales is higher than the average selling price of a pool of bank owned homes does not mean that banks will get more for a specific home just because it’s a short sale vs. a bank owned home. The reason for this is that those averages are mix dependent. If for some reason the pool of short sales have more higher value homes then the average selling price will be higher.
My own experience is that short sales sell at lower prices because of the pain-in-the-ass factor. Many buyers and their agents avoid short sales because of the 5 month wait and the uncertainty as to what price the bank is going to accept. To offset this issue short sales have to be significantly discounted. In addition, in a short sale the home is still owned by the original buyer, who has no incentive to prep the home for sale. Consequently, many of these homes are in pretty bad shape and don’t show well.
The next part of Brandon’s statement I do agree with:
More banks are now recognizing that treating the problem of delinquent mortgages with short sales rather than bank repossessions can help them minimize their losses and also avoid taking on more REOs, which they then have to manage, maintain and market for sale.
Banks are notoriously incompetent so the sooner they can get rid of these homes the better off they are.

Joe, do you have a graph that also shows foreclosure activity during the bubble years or before for context?
Joe? Who’s Joe?
No, I don’t have that data. I only recently (last few years) started collecting that. But from everything else I’ve seen it was a fraction of where we have been over the last few years.