Attom Data Solutions released their Q1 2018 U.S. Foreclosure Market Report late last week and highlighted a 19% decline in the nation’s foreclosure activity from the first quarter of 2017. Their data for Chicago foreclosure activity in March also showed a significant increase from February, rising to the highest level since October. Nevertheless, it was down almost 23% from last March. Of the top 25 metro areas with more than 1 million people Chicago ranked #11 for foreclosure activity.
The graph below shows the key components of foreclosure activity and it was mostly bank repossessions that primarily drove the increase. At least that’s the tail end of the process.
Daren Blomquist, senior vice president at ATTOM Data Solutions, pointed out the progress that is being made in clearing out the backlog of foreclosures but also sounded a cautionary note:
Less than half of all active foreclosures are now tied to loans originated during the last housing bubble, one of several data milestones in this report showing that the U.S. housing market has mostly cleared out the backlog of bad loans that triggered the housing and financial crisis nearly a decade ago. Meanwhile we are beginning to see early signs that some post-recession loan vintages are defaulting at a slightly elevated rate, a sign that some loosening of lending standards has occurred in recent years. Consequently, foreclosure starts are trending higher compared to a year ago in an increasing number of local markets — some of which are a bit surprising given the overall strength of housing in those markets.
Attom Data Solutions also reported on the time required to complete a foreclosure, which has been steadily rising since they’ve been reporting the data – until this last quarter. For the first time we saw a drop in this absurd number and it was big. The average days fell by 23% and went back below 800.
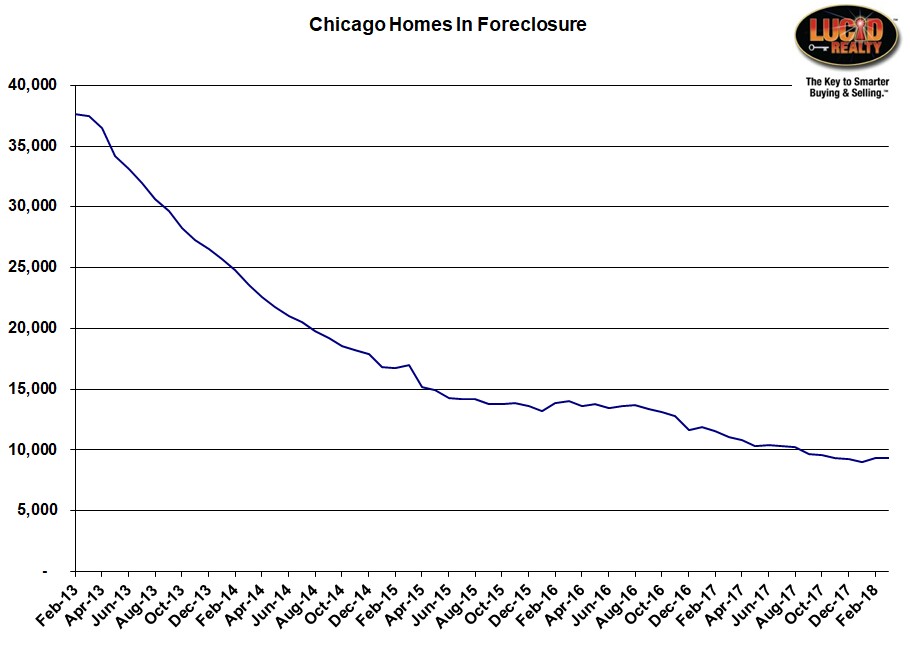
Chicago Shadow Inventory
Despite the increase in bank repossessions noted above, which should have moved a bunch of foreclosures out of the pipeline, the number of Chicago homes in the foreclosure process actually rose once again to the highest level in 5 months. The graph below shows the long term history of this “shadow inventory” and, after a long term decline, it has ticked up the last couple of months. But I’m confident that this number will continue to decline over time.
#Foreclosures #ChicagoForeclosures
Gary Lucido is the President of Lucid Realty, the Chicago area’s full service discount real estate brokerage. If you want to keep up to date on the Chicago real estate market, get an insider’s view of the seamy underbelly of the real estate industry, or you just think he’s the next Kurt Vonnegut you can Subscribe to Getting Real by Email using the form below. Please be sure to verify your email address when you receive the verification notice.


