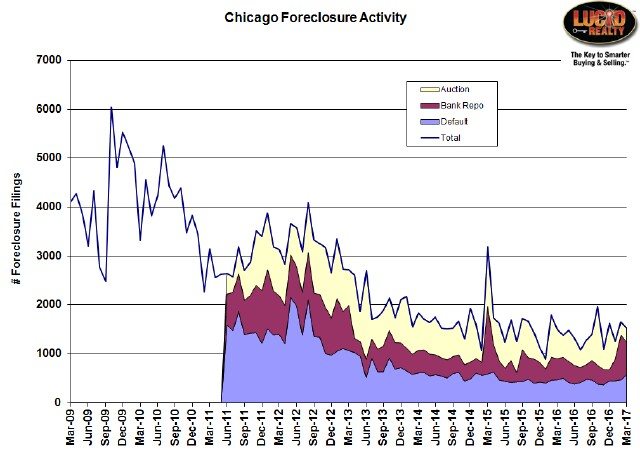
Just when we thought the mortgage crisis was long behind us this morning’s RealtyTrac March Foreclosure Market Report came out along with their Chicago foreclosure activity data – the latter showing what might be the early stages of a disturbing trend. Looking at the graph below you will see that there is a lot of noise in the total activity but most of that noise seems to come from the auction component (yellow area). But look at the two components below that and there seems to be an upward trend forming.
I’m actually not so concerned about the bank repossession piece in burgundy because, as I’ve pointed out many times in the past, it represents foreclosures being resolved. What is definitely more concerning is the mortgage default component in blue below that which just jumped to it’s highest level in almost two years. And that component, which has risen for the last 4 months, represents new foreclosures entering the pipeline.
 RealtyTrac pointed out that nationwide foreclosure activity was below pre-recession levels, which they measured from Q1 2006 – Q3 2007. You can see the historic level of national foreclosure starts and completions in their graph below. Well, that’s really interesting but what I want to know is how does current foreclosure activity compare to pre-bubble activity. Heck, the bubble was well underway during 2006 and you can plainly see in the graph below that foreclosures starts were already on an upward trend at the beginning of 2006.

Daren Blomquist, senior vice president with ATTOM Data Solutions, noted that
U.S. foreclosure activity on a quarterly basis first dipped below pre-recession averages in the fourth quarter of last year, and this report shows that trend continuing for the second consecutive quarter. The number of local markets dropping below pre-recession levels continues to grow, up from 78 a year ago to 102 in this report.
Well, Chicago is not one of those markets that has dropped below pre-recession levels. In fact, the greater Chicago metropolitan area is still 9.2% above RealtyTrac’s pre-recession level, though it is down 68% from the peak.
Chicago Shadow Inventory
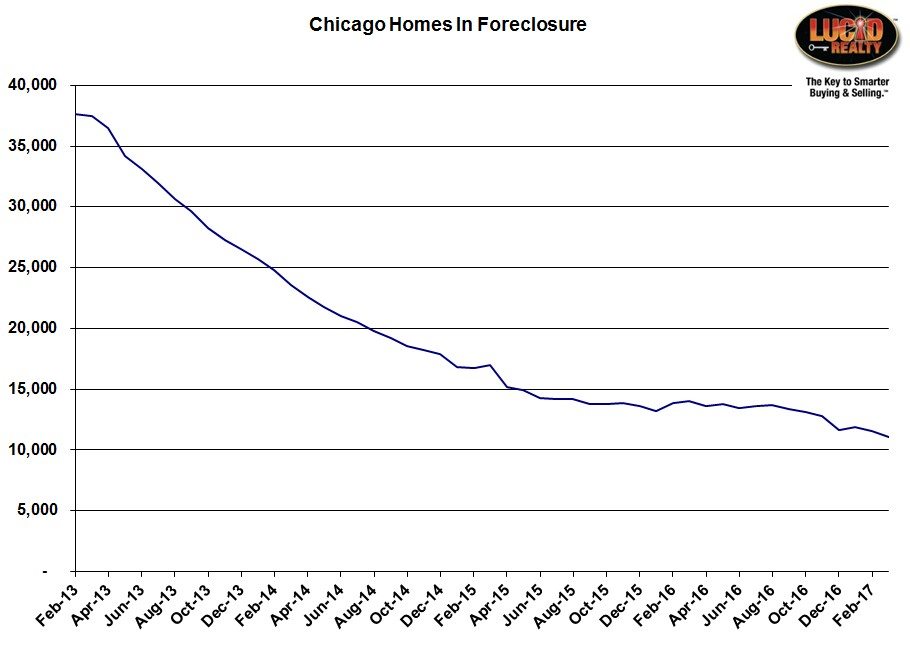
However, there is some good news in the Chicago foreclosure data this month. The total number of homes in Chicago that are in the foreclosure pipeline just hit a new low – and with a healthy decline from February. As you can see in the graph below the number of foreclosures remained fairly flat for a year or two in the 2015 – 2016 timeframe but then regained momentum recently. We may even break the 10,000 unit level soon.
#Foreclosures #ChicagoForeclosures
Gary Lucido is the President of Lucid Realty, the Chicago area’s full service discount real estate brokerage. If you want to keep up to date on the Chicago real estate market, get an insider’s view of the seamy underbelly of the real estate industry, or you just think he’s the next Kurt Vonnegut you can Subscribe to Getting Real by Email using the form below. Please be sure to verify your email address when you receive the verification notice.
