A couple of weeks ago ATTOM Data Solutions released their mid-year Foreclosure Market Report and late last week they updated the local foreclosure data on their RealtyTrac Web site. Foreclosure activity for the nation was down 18% from a year ago to the lowest level in the 12 years shown in the graph below. However, 36 of the 220 metro areas followed in the report actually showed an increase in foreclosure activity and of the 5 metro areas with the biggest percentage increases 4 were in Florida. What’s that all about? Florida indeed was #4 in the nation in terms of foreclosure rate while Illinois continues to rank #5.
Foreclosure activity in the second quarter of 2019 was below pre-recession levels for the nation as well as 136 of those 220 metro areas. The nation has now had 11 consecutive quarters where foreclosure activity was below pre-recession levels.

In the graph below you can see how the time required to complete a foreclosure has fallen once again after spiking back up for a couple of quarters. However, it still takes way too long to complete this process so this shadow inventory hangs over the market and the homes rot in the ground.
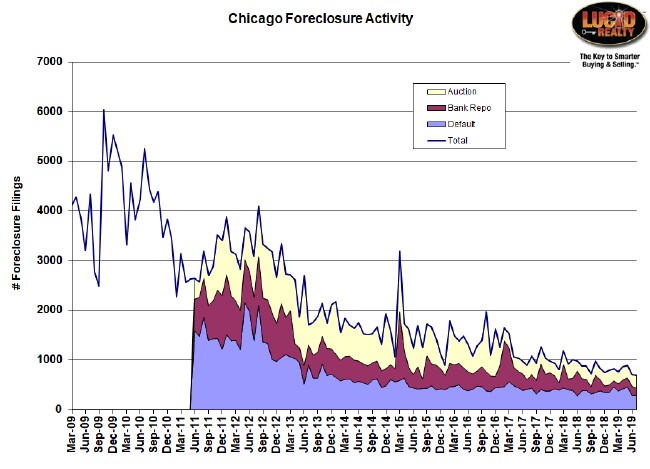
Using the RealtyTrac data I’ve updated my Chicago foreclosure activity graph below. It turns out that my June data was off. Instead of flat activity from May June actually hit a new low and July was even slightly lower. Both defaults and bank repossessions were at the lower end of the historic range. Of the three components defaults is the most important because it represents the first stage of the foreclosure process and low defaults mean that there will be fewer foreclosures.
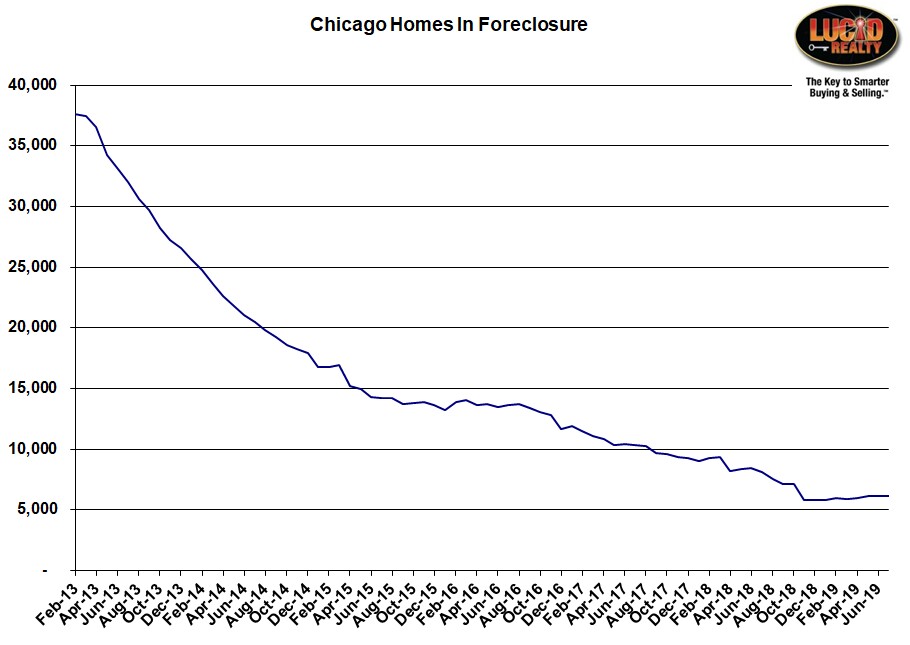
Chicago Shadow Inventory
After years of steady decline the number of Chicago homes in some stage of foreclosure (the shadow inventory) plummeted in November of last year. But since then it has actually drifted up by nearly 340 units, making this one of the longer periods without a drop. You can see in the graph below how this period stands out. There was a similar period in late 2015/ early 2016 but eventually the shadow inventory resumed its downward trajectory. Of course, now we are much closer to a bottom – i.e. you can’t go below zero.
#Foreclosures #ChicagoForeclosures
Gary Lucido is the President of Lucid Realty, the Chicago area’s full service real estate brokerage that offers home buyer rebates and discount commissions. If you want to keep up to date on the Chicago real estate market or get an insider’s view of the seamy underbelly of the real estate industry you can Subscribe to Getting Real by Email using the form below. Please be sure to verify your email address when you receive the verification notice.


