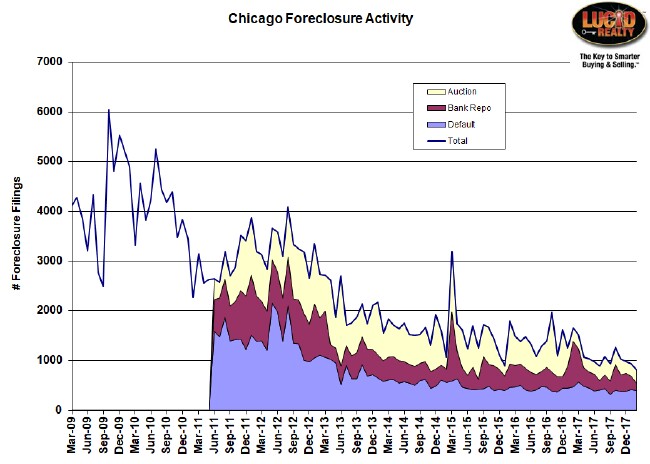
Yeah, I intentionally wrote a confusing headline in order to make a point. Attom Data Solutions just posted the February foreclosure activity data on their RealtTrac Web site, though they did not issue a new report (that will likely come with next month’s data release). The Chicago foreclosure data apparently tells a contradictory story. On the one hand foreclosure activity hit a new low during the time period that I’ve been tracking it – down more than 50% from last year.
In the graph below you can see the individual components of foreclosure activity and the big decrease was primarily driven by a new low in bank repossessions, though the other components also remain near historic lows.
Chicago Shadow Inventory
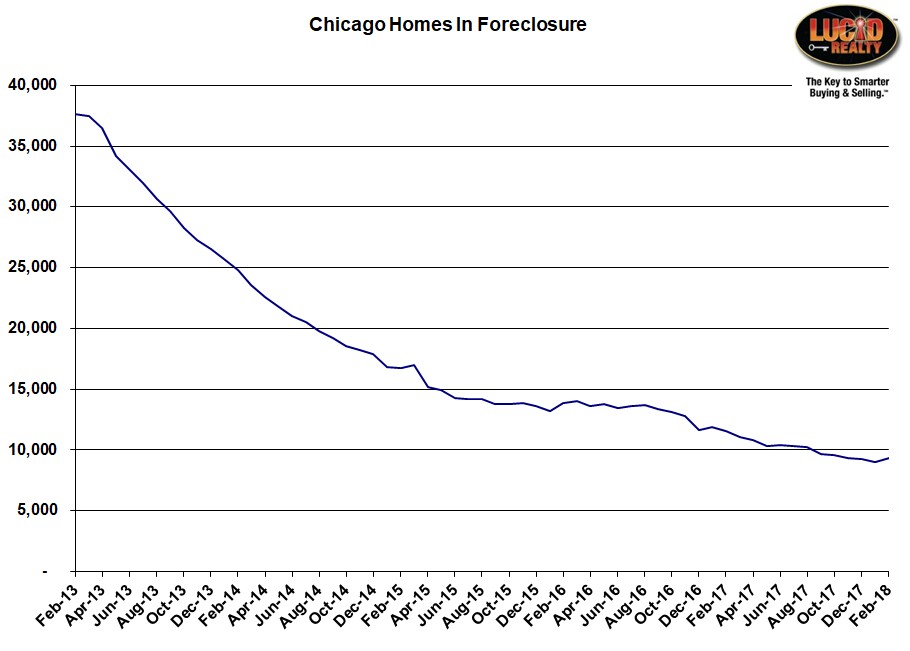
However, at the same time the number of Chicago homes that are at some stage of the foreclosure process actually ticked up by more than 300 units in February, crossing back above the 9000 line. The graph below provides an historic perspective on this number and you can see the uptick.
So how does this jibe with the foreclosure activity data? Well, as I’ve pointed out before, bank repossessions actually represent a conclusion of the foreclosure process so a decline in this activity could actually stall the disposition of foreclosures already in the pipeline. Meanwhile, new defaults continue to flow into the front end of the pipeline. In addition, I’m sure some of this data is a bit squishy to begin with.
#Foreclosures #ChicagoForeclosures
Gary Lucido is the President of Lucid Realty, the Chicago area’s full service discount real estate brokerage. If you want to keep up to date on the Chicago real estate market, get an insider’s view of the seamy underbelly of the real estate industry, or you just think he’s the next Kurt Vonnegut you can Subscribe to Getting Real by Email using the form below. Please be sure to verify your email address when you receive the verification notice.

