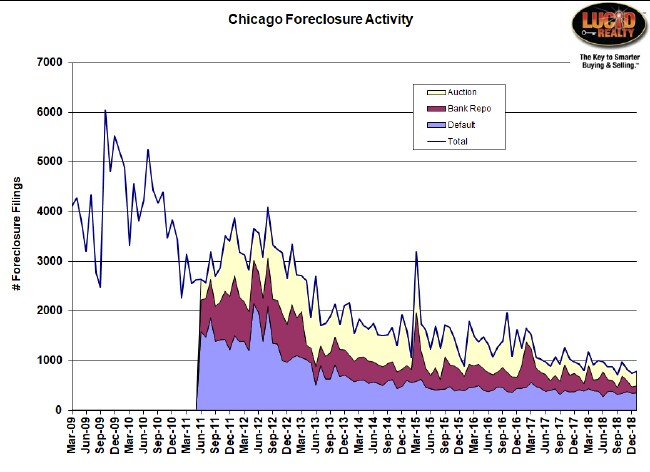
ATTOM Data Solutions updated their foreclosure data on the RealtyTrac Web site last week and released a short report on national foreclosure activity for January. Despite an 8% increase in national activity over December there was a 19% decline from last year. Chicago foreclosure activity pretty much followed the same pattern with a 6% increase over December but a 16% decline from last year.
The graph below shows just how much Chicago’s foreclosure activity has died down over the last 6 years. All 3 components (shown in the three colors) have declined in tandem and the January total was the third lowest since I’ve been keeping track. In fact, over the last 22 months there has been only one month when activity increased from the prior year period.
Chicago Shadow Inventory
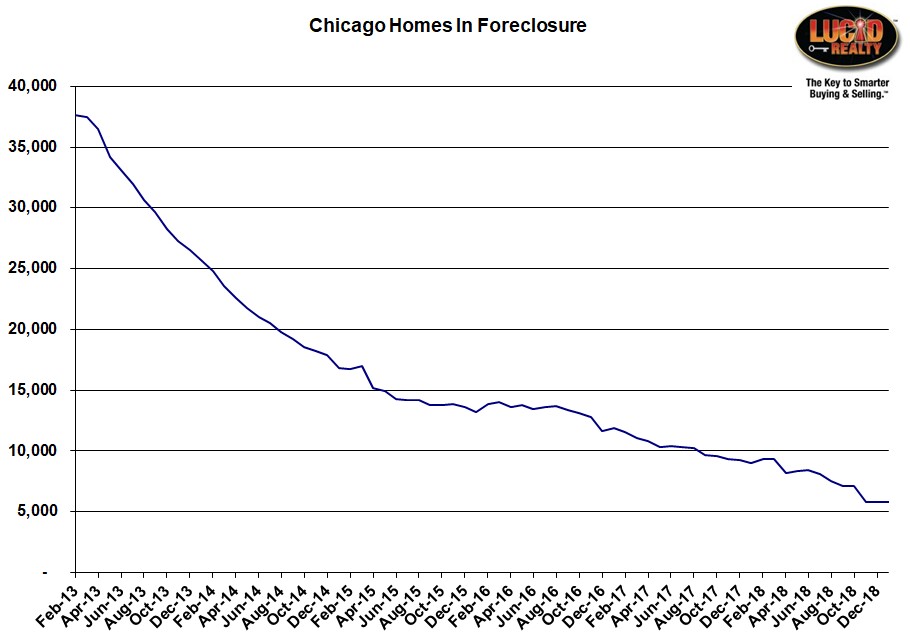
But, at the end of the day, what really matters is how many homes are sitting on the sideline, slowly creeping through the foreclosure pipeline. That is captured in the graph of Chicago homes in foreclosure below, which is currently near a historic low. After experiencing a huge plunge in November (might have just been a some kind of data cleanup in my opinion), the numbers have crept up just a tad in the last 2 months. Nevertheless, it’s clear that this backlog continues to make steady progress.
#Foreclosures #ChicagoForeclosures
Gary Lucido is the President of Lucid Realty, the Chicago area’s full service real estate brokerage that offers home buyer rebates and discount commissions. If you want to keep up to date on the Chicago real estate market, get an insider’s view of the seamy underbelly of the real estate industry, or you just think he’s the next Kurt Vonnegut you can Subscribe to Getting Real by Email using the form below. Please be sure to verify your email address when you receive the verification notice.

