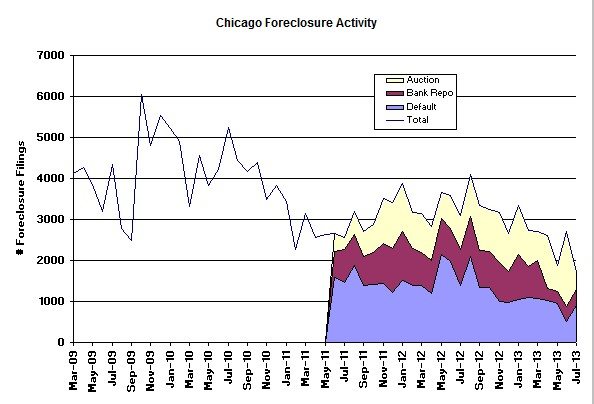
The RealtyTrac Foreclosure Market Report for July that came out just this morning continues to show a nice, overall decline in foreclosure activity in Chicago, continuing a trend that seems to have begun back in the fall of 2009. I flipped the graph below around a bit from previous versions in order to better highlight what is going on. Since defaults in particular have been less volatile than the auctions and have been more or less steadily trending downward I now have that at the bottom to make the pattern more discernible. You can also tell that bank repossessions have been declining. Auctions on the other hand have recently experienced a lot of volatility but came down in July after a huge June.
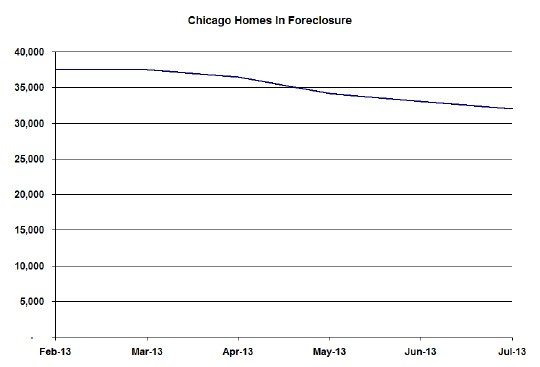
The net effect of all this is that, with the front end of the pipeline (defaults) shrinking, the number of Chicago properties in some stage of foreclosure (the shadow inventory) is also on the decline. Now that I have 6 months worth of these numbers I am graphing it below. Clearly we have a long way to go to work through this backlog but as I pointed out in my July Chicago real estate market update the percentage of sales which are distressed is at a five year low and this is what is driving it down.
Daren Blomquist, vice president of RealtyTrac, provided some interesting historical context on where the nation is in terms of foreclosure activity.
U.S. foreclosure activity in July is 64 percent below the peak of more than 367,000 properties with foreclosure filings in March 2010, but is still 54 percent above the historical average of 85,000 properties with foreclosure filings per month before the housing bubble burst in late 2006. There are a dozen states, however, where foreclosure activity levels in July were at or below average monthly levels prior to the bubble bursting. Those states include Texas, Colorado, Oklahoma, Indiana and Michigan, and we expect the number of states in this category to increase in the coming months.
Here is the graph that Daren was referencing in his statement.
If you want to keep up to date on the Chicago real estate market, get an insider’s view of the seamy underbelly of the real estate industry, or you just think I’m the next Kurt Vonnegut you can Subscribe to Getting Real by Email.


