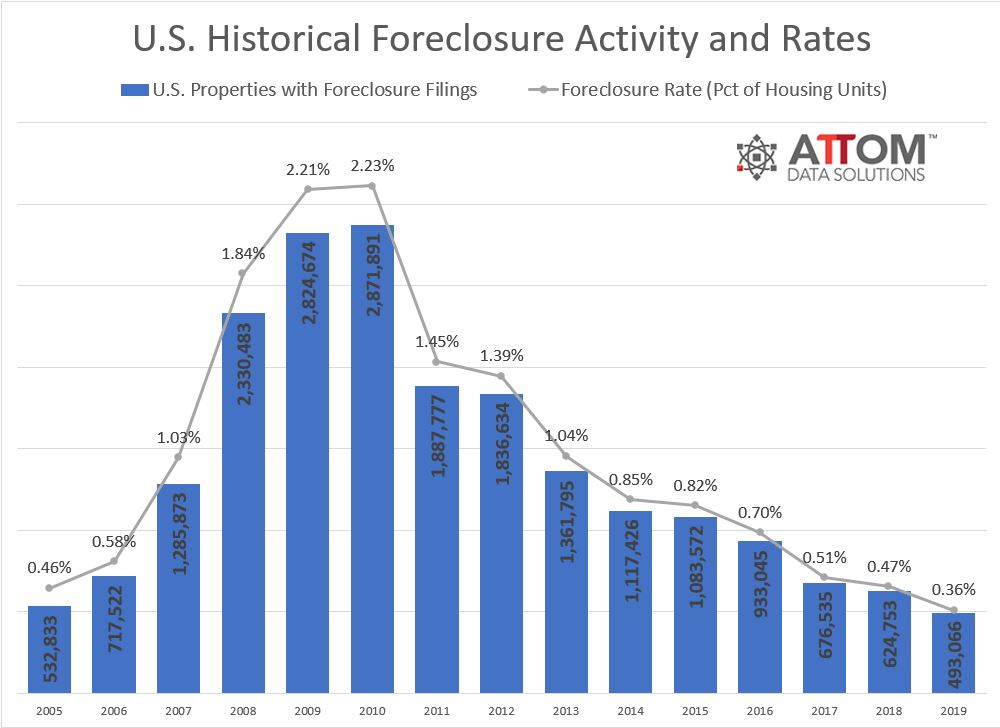
ATTOM Data Solutions released their year end foreclosure market report for 2019 late last week, reporting that both the nation’s foreclosure activity and its foreclosure rate hit an all time low for the 15 year tracking period. You can see this in their graph below.
However, Todd Teta, chief product officer for ATTOM Data Solutions, did provide some words of caution regarding their foreclosure data:
The continued decline in distressed properties is one of many signs pointing to a much-improved housing market compared to the bad old days of the Great Recession. That said, there is some reason for concern about the potential for a change in the wrong direction, given that residential foreclosure starts increased in about a third of the nation’s metro housing markets in 2019. Nationally, the number also ticked up a bit in December. While that’s not a major worry, it’s something that should be watched closely in 2020.
As I’ve often pointed out it’s the foreclosure rate/ foreclosure starts (defaults) that you need to keep an eye on.
Ohan Antebian, general manager for ATTOM’s RealtyTrac, went on to to talk about how the strong economy has really helped:
As wages rise, interest rates drop, the stock market keeps hitting new highs and the broader economy remains healthy, the factors that lead to foreclosure simply aren’t there. While home prices are rising, homeowners can afford them. The drop-off has been so steep that for every 10 completed foreclosures following the housing market crash a decade ago, there now is just one.
Illinois and Chicago received prominent mention in ATTOM Data’s report:
- Illinois was one of the top 5 states for the number of completed foreclosures over the last 10 years (I think it was #5).
- Illinois had the 5th highest foreclosure rate in the nation in 2019
- Chicago had the 3rd highest foreclosure rate among large metro areas in 2019
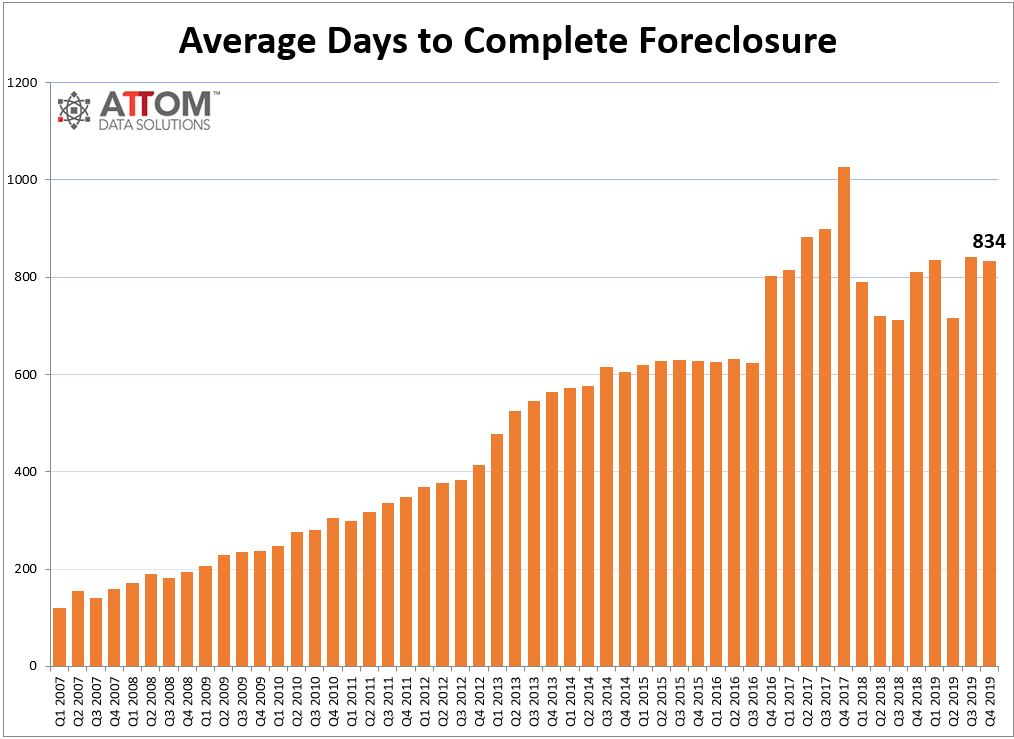
The foreclosure report also showed that it still takes a really long time to complete a foreclosure. For a while it looked like the length of time was trending down but then it popped back up again. It now stands at 834 days, which is ridiculous.
ATTOM Data Solutions also updated their local foreclosure data on the RealtyTrac Web site and it shows Chicago foreclosure activity rebounding a bit from November’s near record low and also up about 8% from the previous December. The largest component of the increase was in the number of properties going to auction so at least it was on the back end of the process. And since November hit a record low in auction activity it’s not that surprising that we saw such an increase
Chicago Shadow Inventory
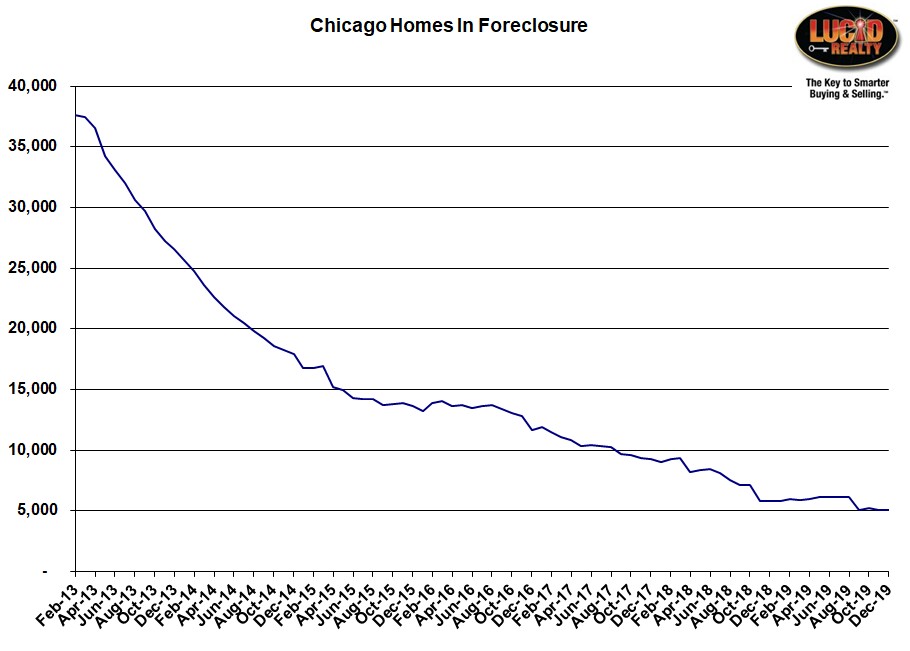
Technically the number of Chicago homes in foreclosure declined in December but by such a small amount (only 11 units) that it hardly qualifies as any change at all. And it has actually increased by 28 units since September so, really, we’ve stalled once again. If you look at the graph below you’ll see that this has happened several times in the past and then all of a sudden there’s a big drop. I think the data is unreliable personally.
#Foreclosures #ChicagoForeclosures
Gary Lucido is the President of Lucid Realty, the Chicago area’s full service real estate brokerage that offers home buyer rebates and discount commissions. If you want to keep up to date on the Chicago real estate market or get an insider’s view of the seamy underbelly of the real estate industry you can Subscribe to Getting Real by Email using the form below. Please be sure to verify your email address when you receive the verification notice.


