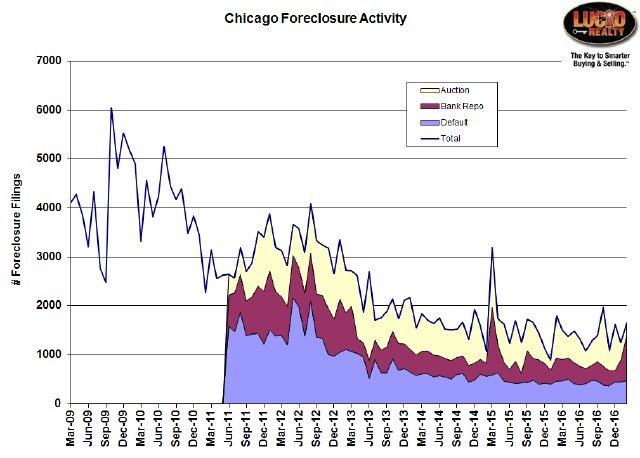
We have yet another month without an official Foreclosure Market Report from RealtyTrac but they did update their data last week which I used to update my Chicago foreclosure activity graph below.
As you can see total foreclosure activity has pretty much leveled off in the last 2 years but the individual components are even more volatile than the total. For instance in February bank repossessions surged to their highest level in 2 years. As I’ve pointed out before this is not a bad thing since banks taking possession of these properties is part of the process of dealing with the problem. As long as we are dealing with the existing problems at a faster rate than we are creating new ones. Defaults is the indicator of new problems being created and, as you can see in the graph below, that remains fairly stable.

As you can see there was a very gradual increase in the number of completed foreclosures throughout much of the early 2000s with the first significant increase occurring in 2006. Completions peaked in 2010.
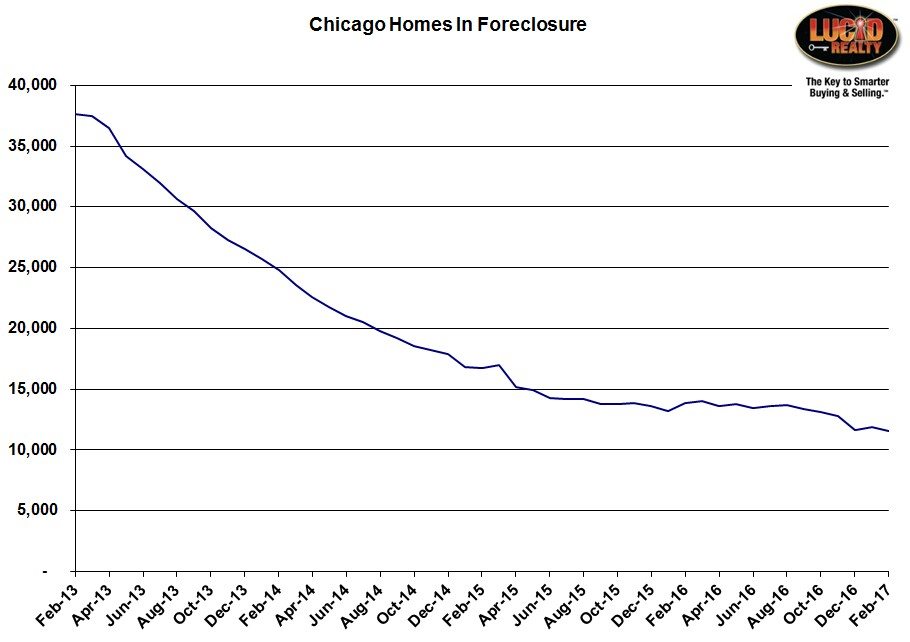
 Chicago Shadow Inventory
The good news is that Chicago’s shadow inventory (homes in the foreclosure process) continues to decline so apparently we are indeed solving old problems faster than we are creating new ones. February hit a new low after we saw a slight uptick in January.

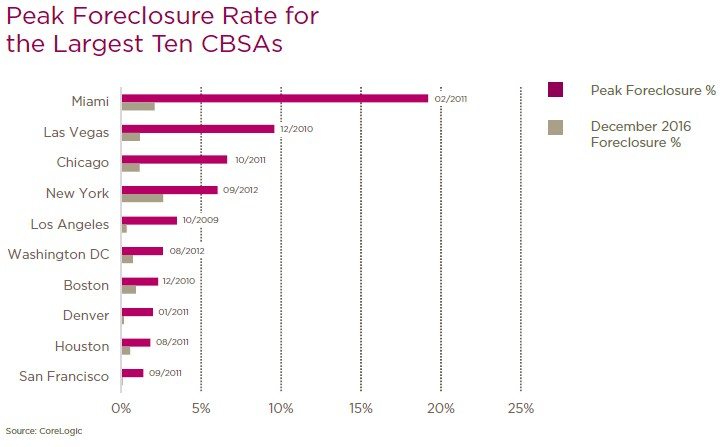
In the interest of full disclosure I have to tell you that I can’t for the life of me figure out how CoreLogic defines the “foreclosure rate”. Is it the percentage of homes IN the foreclosure process or the percentage ENTERING the foreclosure process or COMPLETING the foreclosure process. Shame on them for not being clear on this but maybe they define it globally somewhere on their site.
#Foreclosures #ChicagoForeclosures
Gary Lucido is the President of Lucid Realty, the Chicago area’s full service discount real estate brokerage. If you want to keep up to date on the Chicago real estate market, get an insider’s view of the seamy underbelly of the real estate industry, or you just think he’s the next Kurt Vonnegut you can Subscribe to Getting Real by Email using the form below. Please be sure to verify your email address when you receive the verification notice.

