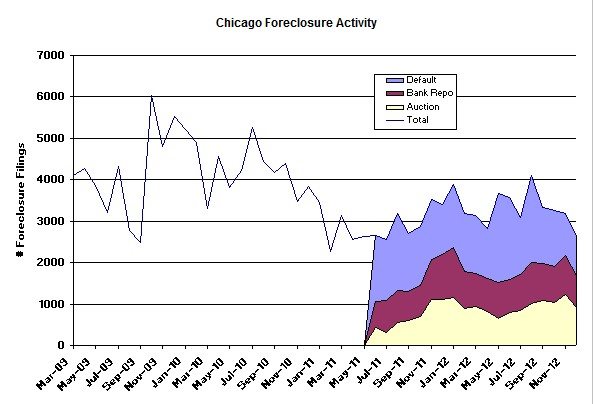
Throughout much of 2011 and 2012 Chicago foreclosure activity was trending up but in the last few months of 2012 it took a decidedly better turn. RealtyTrac just released their year end Foreclosure Market Report for the nation along with data at the local level. In the graph below I plot their foreclosure activity data that I have been collecting for Chicago and December is the third month that has shown a decline. In fact, you can see that overall we are approaching the lows of the last 3 years. Even better news is the fact that defaults, which feed the foreclosure pipeline, are now at the lowest level since I’ve been breaking out the data. You can’t tell that from the graph but trust me on this one.
This data, along with Chicago’s rather stable mix of distressed sales, further support my growing conclusion that we have seen the worst of the foreclosure mess. And with overall home inventories at such low levels you would think the banks would have very little incentive to hold back the shadow inventory.
At the national level the picture is much the same. In fact, as RealtyTrac’s graph below shows foreclosure activity reached its lowest level in 5 years. December hit a 68 month low.
Of course the story differs at the local level and Daren Blomquist, vice president at RealtyTrac, explains these differences in terms of the legal process that exists within different states – i.e. whether a state uses a judicial process or not. As you might expect a judicial process moves significantly slower. As Daren explains:
That could mean that although we are comfortably past the peak of the foreclosure problem nationally, 2013 is likely to be book-ended by two discrete jumps in foreclosure activity. We expect to see continued increases in judicial foreclosure states near the beginning of the year as lenders finish catching up with the backlogs in those states, and another set of increases in some non-judicial states near the end of the year as lenders adjust to the new laws and process some deferred foreclosures in those states.
Other interesting findings from the report:
- 26% of homeowners nationwide were still seriously underwater on their mortgages. That means they owed at least 25% more than their home is worth.
- As you might expect the bulk of the foreclosure inventory is at the lower end. 70% of the inventory has a market value below $200,000.
- Government affiliated organizations like Fannie, Freddie, and HUD own the biggest chunk of the inventory at 26%. Yeah, let’s blame greedy bankers for the crisis.
- Chicago had the 9th highest large metro area foreclosure rate in the country for 2012 at 3.31%

