About once a year (usually during the peak crime season) I do a couple of blog posts on Chicago crime and which neighborhoods are the most dangerous. My last one was in July: Chicago’s Most Dangerous Neighborhoods: Assault And Battery. These posts focus on where most of the crimes occur and I’ve often noted the visual correlation between high crime areas and lower income levels.
Well, RealtyTrac has just come out with a new Registered Criminal Offender Risk Index, which covers 10,000 US zip codes and it looks at the problem slightly differently – not where crimes are committed but where criminals live. (Yeah, there MIGHT BE a strong correlation between the two.) Then they compared the density of registered criminals with various real estate metrics such as home values, home sale prices, home price appreciation, foreclosure activity, etc…
They found a slight pattern in “that average home price appreciation has been slightly stronger over the past year and five years in zip codes with a higher offender index than in zip codes with a lower offender index, but only zip codes with an offender index in the bottom 20th percentile have seen home prices rebound above levels from 10 years ago.” In other words, if you want your neighborhood’s home values to rise you should invite a lot of criminals to live there. I don’t think so. Such is the fallacy of believing that correlation implies causation.
The more interesting findings from their research are what we would expect all along: “average home values and home equity were lower — while average foreclosure rates were higher — in zip codes with a higher offender index than in zip codes with a lower offender index.” The pattern with home values and foreclosure rates is pretty clear – if you ignore that last bar in the graphs which I think detracts from the overall points.

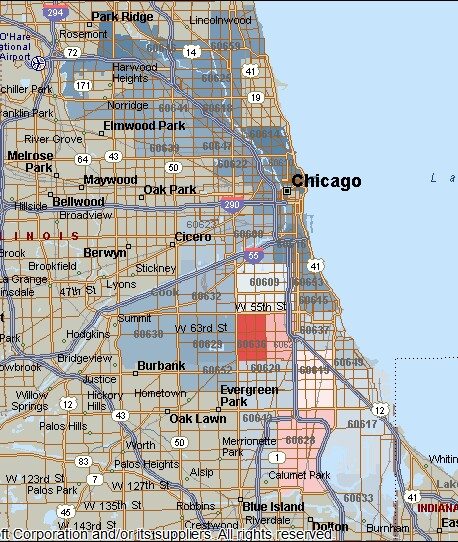
The RealtyTrac folks were kind enough to send me their raw data so that I could analyze it for Chicago and voila! I produced the heat map below, which reflects a low concentration of criminals in dark blue and high concentration areas in dark red. Unfortunately, several zip codes (e.g. West of downtown) were missing from the data and they simply show up as gray areas but the rest of the areas pretty much look like what we’ve seen before.
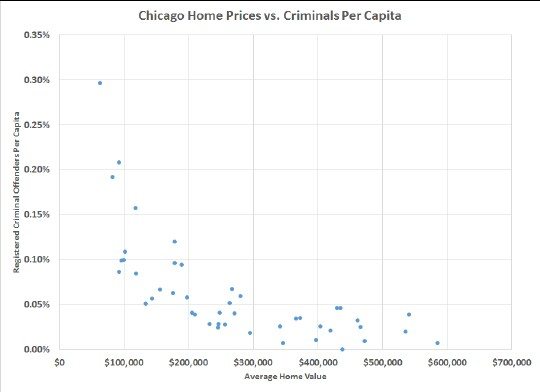
I also used their data to create the scatter plot below, which shows the correlation between criminal offender risk and home prices for the Chicago zip codes. Basically, once the average home value in a Chicago zip code dips below $200,000 the criminal offender risk rises, and it skyrockets the lower the home values go. Of course, as I alluded to earlier, you can’t draw any conclusions regarding cause and effect. Is the presence of criminals depressing home values or do depressed home values attract/ create criminals?
Daren Blomquist, senior vice president at RealtyTrac, seems to imply that it’s the former: “This new index provides concrete evidence that registered criminal offenders pose not only a potential safety risk for homeowners and their families, but also a potential financial risk for what is likely a homeowner’s biggest asset.” But the reality is that they really can’t know for sure from this data.
#ChicagoCrime #Crime
Gary Lucido is the President of Lucid Realty, the Chicago area’s full service discount real estate brokerage. If you want to keep up to date on the Chicago real estate market, get an insider’s view of the seamy underbelly of the real estate industry, or you just think he’s the next Kurt Vonnegut you can Subscribe to Getting Real by Email using the form below. Please be sure to verify your email address when you receive the verification notice.


