Every so often I like to take a look at crime statistics since home buyers often are very concerned about the Chicago crime rate in deciding where to live – Chicago vs. the suburbs and one neighborhood vs. another. There is a Chicago crime data portal that anyone can use to take a look at these statistics. The nice thing about that is that you can look at the crime statistics however you like. In a few months I’ll use it to summarize some neighborhood statistics. However, for the time being I thought it would be interesting to look at the overall trends in violent crime over the last few years.
You can define violent crime in different ways but I included the sorts of crime that newcomers to an area would worry about – assault, battery, robbery, and homicide. You can click on that link to see the difference between assault and battery. I removed domestic crime only because it’s not what people typically worry about. They want to know if they are going to get attacked walking outside or if someone is going to come into their home.
I picked the time period from 2010 onwards only because that is when a new administration came in with a new police chief and I thought it would be interesting to see if changes had occurred under this administration. I was actually pleasantly surprised to see a rather dramatic decline in violent crime – with the exception of murder – during this time period but I’m hesitant to assign credit for this improvement. After all this was a time period of unprecedented economic recovery and with improving employment prospects you would expect a reduction in crime.
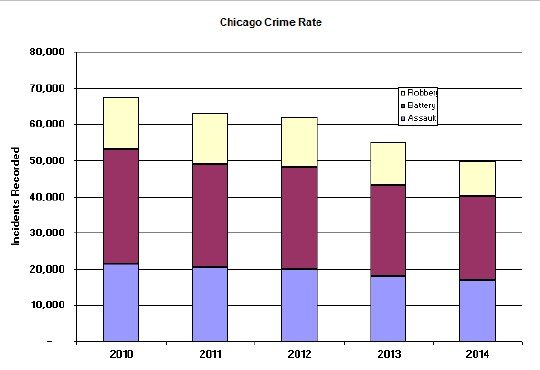
So here is the data, starting with assault, battery, and robbery. As the data portal site points out this database only counts incidents, not victims. I know there was some controversy over this practice a while back but given the statement on the Web site and the way the data looks consistent over time I believe they have been using a consistent reporting method during this time period.
That’s pretty impressive – a 26% decline from 67,321 incidents in 2010 to 49,815 in 2014.
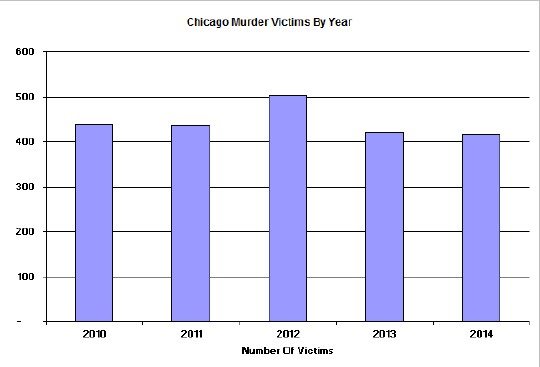
I separately captured the murder data and supposedly this data records the number of victims and not just the number of incidents. As you can see in the graph below there really is no decline in the number of murders over this same time period.
So even though you might be just as likely to be murdered today as in 2010 Chicago still looks like a safer city.
#Chicago #ChicagoCrime
If you want to keep up to date on the Chicago real estate market, get an insider’s view of the seamy underbelly of the real estate industry, or you just think I’m the next Kurt Vonnegut you can Subscribe to Getting Real by Email. Please be sure to verify your email address when you receive the verification notice.

