Earlier this week I received a lot of flack on Cribchatter for focusing exclusively on the Chicago Case Shiller index for Single Family Homes when Chicago’s housing stock is largely condos. Case Shiller provides a separate index for condominiums, though it only goes back to January 1995, while the Single Family home index goes back to January 1987. “G” pointed out that the condo data suggests that condominium prices have not bottomed in Chicago.
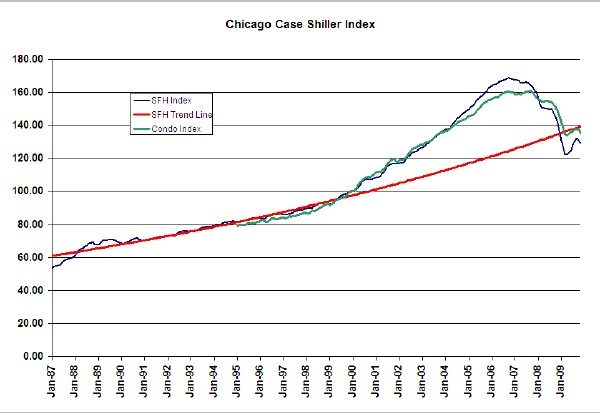
So I promised to take a more in-depth look at the data. Herewith is the condo index superimposed upon the single family home data, along with the trend line for single family homes.
I should first point out that these indices are normalized to 100 for January 2000, so they arbitrarily cross at that date. What you see from this graph is that condo prices have tracked pretty closely with single family prices until the bubble really took off, at which time single families went a bit higher. Subsequently, single family home prices dropped much more than condo prices until today when the single family index is below that for condos. Both indices hit a low point in April of 2009, after which they began to recover, recently they declined a bit more. Based upon this “G” suggested that the condo index has a really good chance of hitting a new bottom.
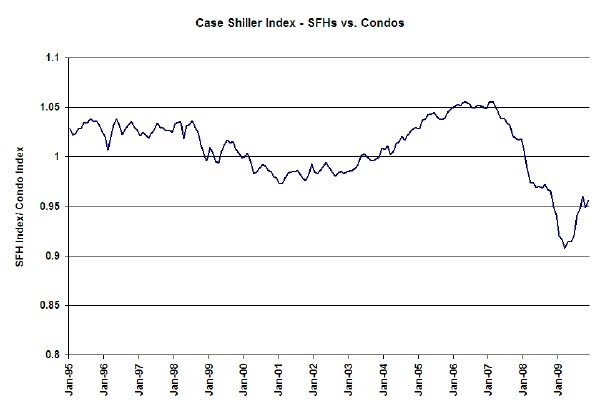
In order to gain perspective on that claim I tried a couple of different analyses. First, I looked at the historic ratio of the two indices – the single family home index divided by the condo index. Since in the long run the two classes of housing should appreciate at the same rate one would expect the ratio to fluctuate around a constant value.
The only “normal” period is from 1995 – 1998 (pre-bubble), when the ratio of the indices averaged 1.027. That’s a pretty short period in which to attempt to determine a normal ratio. After that you can see how the ratio peaked at 1.05 as single family home prices grew faster than condos and then dropped to almost .9 as they crashed faster than condos. However, even if we expect the ratio to climb back above 1 there are two ways for that to happen: either single family home prices can climb or condo prices can fall further. Given that the single family home price index is well below the trend line I would expect the former.
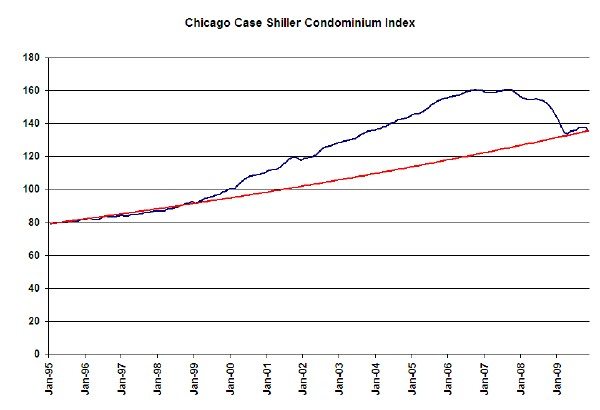
The other perspective I tried was to develop a trend line for condo prices. Since we don’t have much history I borrowed the single family trend line and adjusted it for the average ratio of the two indices from 1995 – 1998.
Based upon this trendline it looks like condo prices in Chicago have returned to trend. Of course, that doesn’t mean that condo prices can’t fall below trend but I can’t believe they can fall much further. While single family homes overshot on the downside, they were falling from a bit higher level than condo prices. I would also expect the two classes of housing to be subject to the same economic factors – i.e. they peaked around the same time and they both hit a low point in April. Perhaps they are climbing out of this quagmire together.
We should know a lot more in the next few months.


