This is huge news for Chicago real estate and something I’ve been waiting for for a long time. S&P just released the November Case Shiller Home Price Index for Chicago and it shows for the first time in 6 years an increase over the previous year. This is an indicator for which Chicago has been lagging the rest of the country for months, being one of only 2 cities out of 20 where prices were still down over the last year. The other city was New York, which is still losing ground.
On a year over year basis single family home prices in Chicago rose by 0.8% in November while condo prices rose by a whopping 2.7%. These are the indicators that really lend some meat to the belief that the Chicago real estate market has finally turned the corner. It was totally expected, given the low level of home inventory and the numerous examples of multiple bids for the few good homes available on the market.
So this month I’ll lead with my year over year Case Shiller chart for Chicago instead of my long term trend data. I picked May 2007 as the starting point in the graph below because that was the first time that single family homes lost value over the previous year but condos were still gaining in value. Within just a few months condos started to lose value as well. That began an almost 6 year uninterrupted period of annual declines in Chicago home prices – so much so that my graph below plots price drops as opposed to price changes. If these price increases continue for a significant period of time I will have to invert my graph.

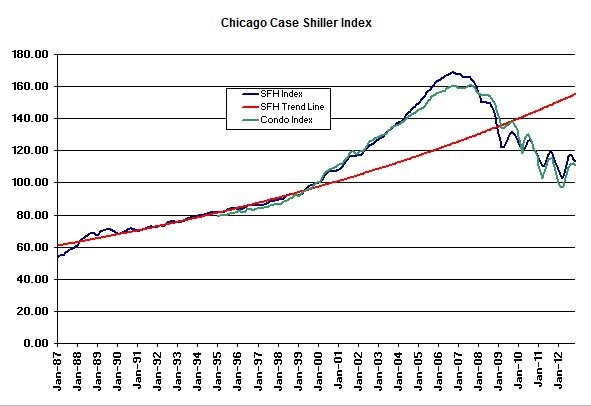
The graph below shows the long term trend in the home price index for Chicago. What the media is focusing on today is that single family home prices still dropped 1.3% from October levels, but that is mostly due to normal seasonality. They are still up 10.3% from last year’s seasonal low in March. But they are also back to the level they were in June 2001 and have fallen a total of 32.8% from the bubble peak. No doubt Chicago home prices have a long way to go before recovering all the losses but they are running 27.1% below the long term trend line in red below. One would think that a recovery is inevitable.
Chicago condo prices dropped 0.9% from October, which is up 14% from the March low. That puts condo prices back to December 2000 levels and 31.1% below the bubble peak.
S&P focused on several negatives for Chicago in their release:
Chicago was again amongst the weakest with a drop of 1.3% for November…In the context of monthly changes, Boston, Chicago and New York have fared the worst – with more than six months of declining prices in the past 12 months.
However, they sounded a positive note on the nation’s overall housing picture:
Housing is clearly recovering. Prices are rising as are both new and existing home sales. Existing home sales in November were 5.0 million, highest since November 2009. New Home sales at 398,000 were the highest since June 2010. These figures confirm that housing is contributing to economic growth.
