On Thursday Crain’s reported that Illinois foreclosure activity was up 22% in February over last year. For the Chicago area they reported that Kane county was the worst with a 57% increase and Cook, Dupage, Lake, McHenry, and Will counties ranged between a 24 – 29% increase. This data comes from Realty Trac, which defines foreclosure related activity as a property owner receiving a foreclosure related notice. It’s not clear whether or not that includes only first time notices or if it also includes repeat notices.
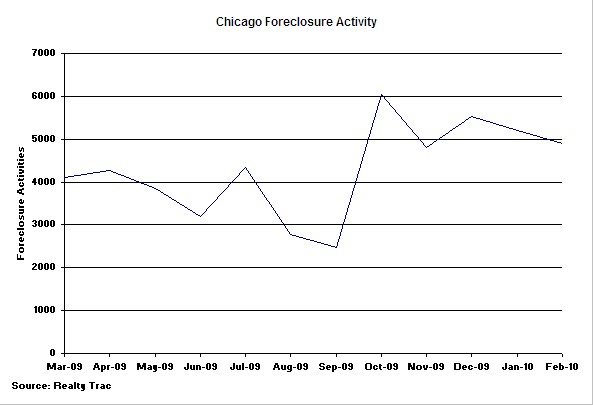
Given that so many housing bears keep talking about the impending doom that will be caused by foreclosures from the massive shadow inventory out there (I’ve heard 7 million), I decided to get a better handle on the situation in Chicago. I went to the Realty Trac site and dug up a few tidbits which will allow me to better track this information going forward. Here is the trend in foreclosures for the last 12 months:
Notice the significant spike in foreclosures that occurred in October. Does anyone have any insights on what exactly happened? Incidentally, in February the Chicago rate of foreclosures was about twice the national average.
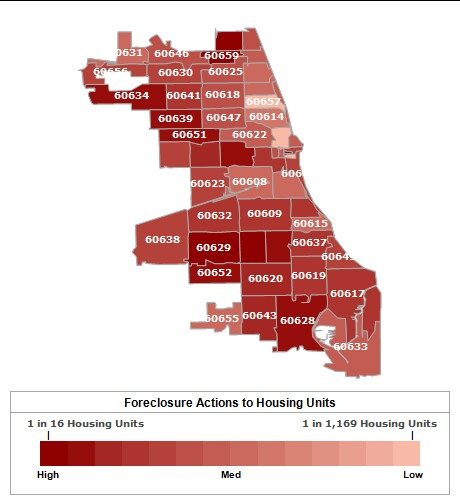
In addition, the Realty Trac Web site has this nifty little interactive heat map of the foreclosure activity rate in Chicago by zip code. The darker colors represent higher rates of foreclosures. As you roll over the graphic (on their site) additional information pops up.

