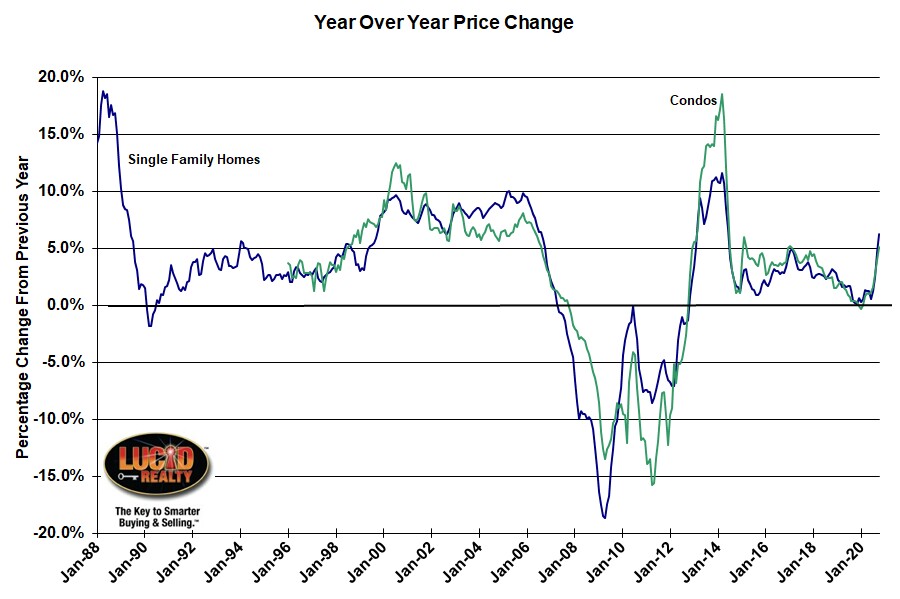
The S&P Dow Jones people released the October CoreLogic Case Shiller home price indices this morning which continue to demonstrate incredible strength in home prices across the nation. Over the past year the nation’s home prices rose by a whopping 8.4%, which is up from an annual appreciation rate of 7.0% for September. The Case Shiller Chicago area index also showed impressive gains of 6.3% over the past year, which is the highest rate of appreciation in more than 6 years. The graph below clearly shows how strong this spike in appreciation has been.
However, that number still places Chicago second from the bottom of the list of 20 metro areas tracked by Case Shiller. There have been reports of Chicago home prices rising faster than the rest of the nation recently but those claims are based on median home sale prices which, as I’ve pointed out many times, can be extremely misleading. I won’t believe these claims to be true until I see it in the Case Shiller numbers.
Chicago condo prices are also doing fairly well despite the fact that condo dwellers seem to be abandoning the downtown area. For the 12 months ending in October Chicago area condo prices rose 5.2% which is the fastest rate of appreciation in about 5 1/2 years.

Craig J. Lazzara, Managing Director and Global Head of Index Investment Strategy at S&P Dow Jones Indices, put the acceleration of home prices in the context of the pandemic.
We’ve noted before that a trend of accelerating increases in the National Composite Index began in August 2019 but was interrupted in May and June, as COVID-related restrictions produced modestly-decelerating price gains. Since June, our monthly readings have shown accelerating growth in home prices, and October’s results emphatically emphasize that trend…Although the full history of the pandemic’s impact on housing prices is yet to be written, the data from the last several months are consistent with the view that COVID has encouraged potential buyers to move from urban apartments to suburban homes.
Case Shiller Chicago Area Home Price Index By Month
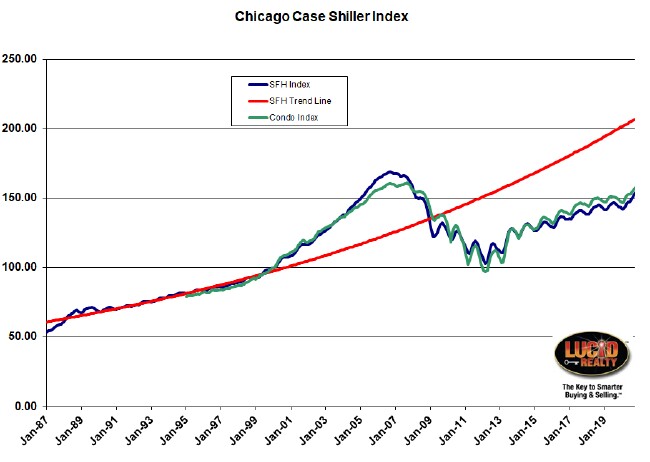
Chicago area single family home prices rose 1.0% from September to October while condo prices rose 0.7%. The monthly history of the Case Shiller index for the Chicago area is graphed below. The graph makes it pretty clear that, even though it’s been 14 years and we’re slowly closing the gap, we still haven’t made it back to the bubble peak levels. Single family home prices fall short of that peak by 8.7% and condo prices fall short by 2.1%. What that boils down to is that the average single family home bought between April 2005 and February 2008 is still under water while condos bought between May 2006 and December 2007 are still hurting.
Or you could look at the graph half full. Since the bottom single family home prices have bounced back 49.8% and condo prices have come back 61.9%.
Then again look at that red trend line I put on the graph, which is based upon average appreciation rates of single family homes prior to the bubble. We’re running 25.7% below that line and it really doesn’t look like we have much of a chance of ever catching back up to it unless we have an extended period of unrealistically much higher home price appreciation.
#ChicagoHomePrices #CaseShiller #HomePrices
Gary Lucido is the President of Lucid Realty, the Chicago area’s full service real estate brokerage that offers home buyer rebates and discount commissions. If you want to keep up to date on the Chicago real estate market or get an insider’s view of the seamy underbelly of the real estate industry you can Subscribe to Getting Real by Email using the form below. Please be sure to verify your email address when you receive the verification notice.
