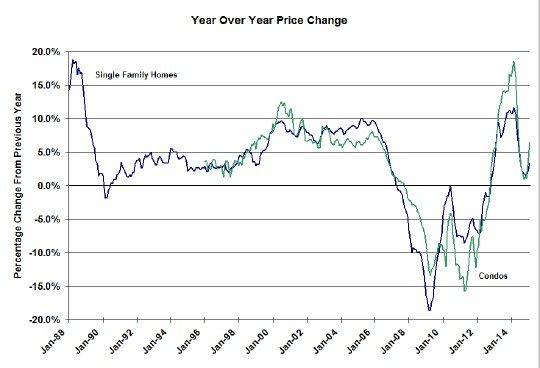
The February Case Shiller Home Price Index just came out for the nation and for 20 metropolitan areas. The Case Shiller Chicago home price index shows that year over year price increases are back on the rise for the second month in a row after essentially 12 months of declines. You can see the relative gains in the graph below where single family home prices were up 3.4% over last year and condos/ townhomes were up a nice 6.4%.
The outlook of so-called experts has been for year over year price increases of 3 – 5% so these numbers are in line with those expectations. These numbers are also in line with what Chicago has historically seen before the real estate bubble, though inflation is much lower now than it was back then. More on that another day.
Seeing year over year price increases is also more in line with the low home inventory levels we’ve been seeing for the past couple of years. It’s been a real mystery to me how we could have such low inventory levels and not see prices going up. Only price will solve the inventory shortage problem that buyers have been struggling with.
When compared to other major metropolitan areas, Chicago still ranks 6th from the bottom in terms of year over year price gains. Denver is still in the #1 spot with a 10% year over year increase for single family homes.
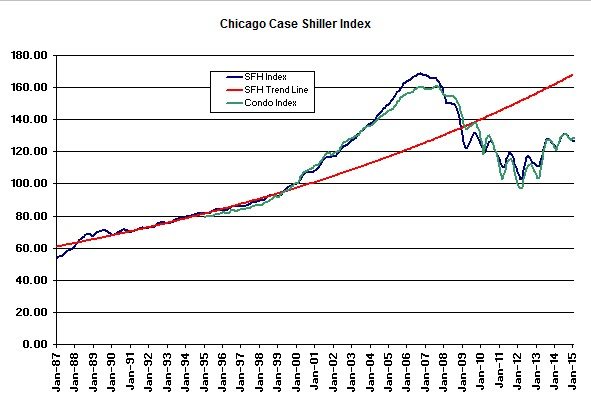
When compared to January single family home prices were essentially unchanged while condos and townhomes rose by 0.6%. The graph below shows the long term trend in both of these numbers along with the long term trend line for single family homes derived from pre-bubble data. Single family home prices are still 24.8% below that long term trend line but it has been pointed out that inflation had been much higher during the time period when that trend line was established.
At the current level single family home prices are down 24.8% from the bubble peak and condos/ townhomes are down 20.0%. From the bottom single family home prices have recovered 23.3% and condos/ townhomes have bounced back by 31.6%, both of which are quite a recovery.
Putting these numbers in a historic perspective, the average single family homebuyer who bought between January 2003 and February 2009 has still lost money as have the condo/ townhome buyers who bought between January 2003 and January 2010. That’s a lot of people. However, it’s important to realize that this represents an average and there are plenty of people who bought in those time periods who are doing just fine because their neighborhoods/ buildings have prospered. Life’s not fair.
David M. Blitzer, Managing Director and Chairman of the Index Committee at S&P Dow Jones Indices which produces the Case Shiller home price index, provided the following perspective on the national housing picture:
Home prices continue to rise and outpace both inflation and wage gains. The S&P/Case-Shiller National Index has seen 34 consecutive months with positive year-over-year gains; all 20 cities have shown year-over-year gains every month since the end of 2012. While prices are certainly rebounding, only two cities – Denver and Dallas – have surpassed their housing boom peaks. Nationally, prices are almost 10% below the high set in July 2006…If a complete recovery means new highs all around, we’re not there yet.
A better sense of where home prices are can be seen by starting in January 2000, before the housing boom accelerated, and looking at real or inflation adjusted numbers. Based on the S&P/Case-Shiller National Home Price Index, prices rose 66.8% before adjusting for inflation from January 2000 to February 2015; adjusted for inflation, this is 27.9% or a 1.7% annual rate.
#CaseShiller #Realestate #HomePrices
If you want to keep up to date on the Chicago real estate market, get an insider’s view of the seamy underbelly of the real estate industry, or you just think I’m the next Kurt Vonnegut you can Subscribe to Getting Real by Email. Please be sure to verify your email address when you receive the verification notice.

