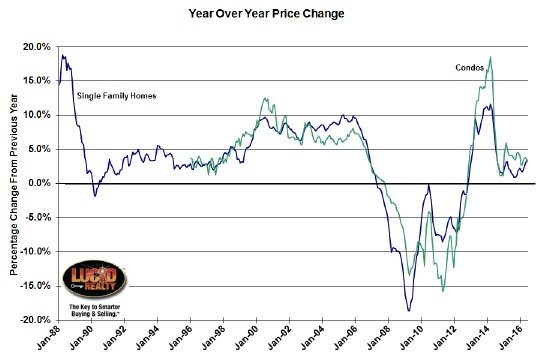
Based upon this morning’s release of the June S&P CoreLogic Case Shiller home price index for the nation and 20 metro areas I would say that Chicago area home prices are still turning in a fairly mediocre performance compared to most of the rest of the country. Not only did the Case Shiller Chicago index rise a mere 3.3% over last year but what I thought was a 3.7% rise last month has now been revised down to 3.3%. What’s even more pathetic is that a 3.3% gain is actually the highest value in 24 months.
Chicago area condo prices were up a slightly better 3.4% over last year but that’s the worst year over year gain in 4 months.
The graph below plots the historic year over year gains for both metrics going back to January 1988 for single family homes. At least we’ve had 44 straight months of year over year gains in both measures.

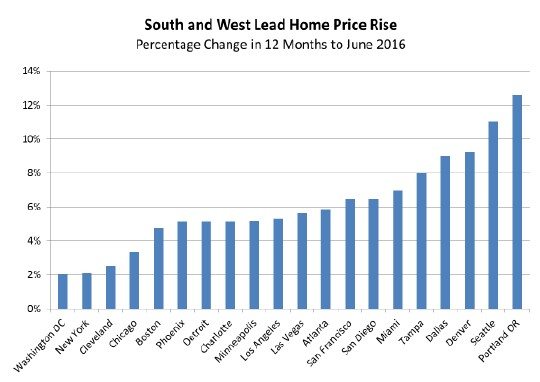
The nation as a whole was up a much stronger 5.1% and the graph below, taken from this morning’s release, shows that Chicago is near the bottom of the 20 metro areas in year over year price gains. What is holding Chicago back? Could it be the financial mess of the city and the state?
David M. Blitzer, Managing Director and Chairman of the Index Committee at S&P Dow Jones Indices, had this to say about that:
Home prices continued to rise across the country led by the west and the south. In the strongest region, the Pacific Northwest, prices are rising at more than 10%; in the slower Northeast, prices are climbing a bit faster than inflation. Nationally, home prices have risen at a consistent 4.8% annual pace over the last two years without showing any signs of slowing.
Overall, residential real estate and housing is in good shape. Sales of existing homes are at running at about 5.5 million units annually with inventory levels under five months, indicating a fairly tight market. Sales of new single family homes were at a 654,000 seasonally adjusted annual rate in July, the highest rate since November 2007. Housing starts in July topped an annual rate of 1.2 million units. While the real estate sector and consumer spending are contributing to economic growth, business capital spending continues to show weakness.
Case Shiller Chicago Home Price Index By Month
The graph below shows the actual home price indices for both single family homes and condos going back to January 1987 along with a trend line based upon the period prior to the housing bubble.
In June single family home prices rose 1.1% from May, which the seasonally adjusted numbers tell me was quite anemic. Condo prices were also up an anemic 1.0% from May. Those gains bring single family home prices up 32.6% from the bottom and condo prices up 44.2%. Yet, single family home prices are still 19.2% from their peak value but condo prices are only off by 12.8%.
To put this in a complete historic context single family home prices are still lower than they were for the period from November 2003 through December 2008 while condo prices are lower than they were from June 2004 through January 2009. In terms of that trend line…well…we’re trailing it by 23% and will probably never catch up to it unless Chicago becomes a much more desirable place to live.
#ChicagoHomePrices #CaseShiller
Gary Lucido is the President of Lucid Realty, the Chicago area’s full service discount real estate brokerage. If you want to keep up to date on the Chicago real estate market, get an insider’s view of the seamy underbelly of the real estate industry, or you just think he’s the next Kurt Vonnegut you can Subscribe to Getting Real by Email using the form below. Please be sure to verify your email address when you receive the verification notice.

