And the good news on the housing front for Chicago home sellers continues to pour in – not so good news for home buyers of course. Case Shiller just released their January home price index for Chicago and the rest of the nation a few minutes ago and, while home prices did decline slightly from January, they are up on a year over year basis at the highest rate in 6 years. This should be no surprise given the low inventory levels that have brought back multiple bids. It just “feels like” prices are rising out here.
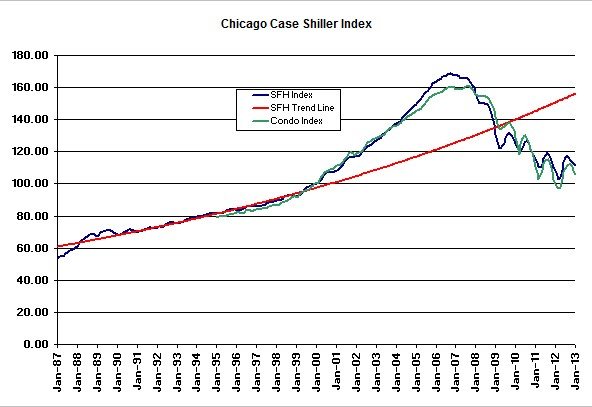
The first graph below shows the Case Shiller home price index for Chicago going back to January 1987 along with my trend line that shows where Chicago home prices logically should have been based upon “normal” price appreciation as if the housing bubble never happened. You may read news stories today about how home prices declined from December and that’s true. Single family home prices declined by 0.9%, which still leaves them at the level they were all the way back in April/ May 2001 and 33.8% below the bubble peak. But at least they are still 8.6% above the low point reached last year, though 28.6% below that long term trend line.
Meanwhile condo prices declined by 2.0% in January. That puts them back to May 2000 price levels, which is 34.2% below the bubble peak for condos. But they are still 8.9% above the low for condos.

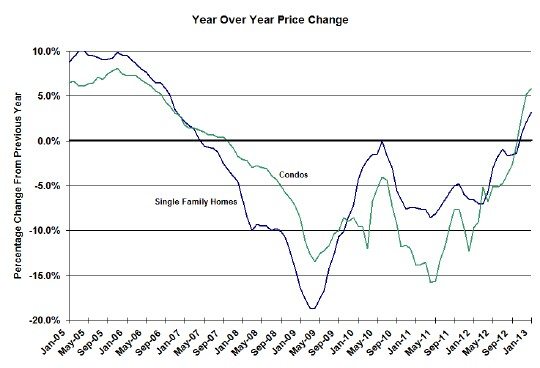
But the real story here is that when it comes to home prices you can’t just look at the change from one month to the next. There’s a pretty significant seasonal effect that you can see in the graph above, where prices always peak during the summer and then fall off during the slow selling season of the winter. To adjust for this Case Shiller produces seasonally adjusted numbers but that’s hard for most people to relate to. What everyone really wants to know is whether or not their home prices have gone up over time. So to satisfy that curiosity we plot how people are doing relative to the same time last year and that’s where the story starts to look a lot more promising.
In Chicago single family home prices were up 3.2% from this time last year and condo prices were up a whopping 5.9%. And things are looking extremely good for the rest of the nation as well. For the first time all the cities in the Case Shiller 20 city composite index turned in positive year over year price changes, which resulted in that index registering an 8.1% increase year over year. The 10 city composite increased by 7.3%.

Here is David Blitzer’s, Chairman of the Index Committee at S&PDow Jones Indices, take on the data:
The two headline composites posted their highest year-over-year increases since summer 2006. This marks the highest increase since the housing bubble burst.
After more than two years of consecutive year-over-year declines, New York reversed trend and posted a positive return in January. The Southwest (Phoenix and Las Vegas) plus San Francisco posted the highest annual increases; they were also among the hardest hit by the housing bust. Atlanta and Dallas recorded their highest year-over-year gains.Economic data continues to support the housing recovery. Single-family home building permits and housing starts posted double-digit year-over-year increases in February 2013. Despite a slight uptick in foreclosure filings, numbers are still down 25% year-over-year. Steady employment and low borrowing rates pushed inventories down to their lowest post-recession levels.