The good news is that low home inventories are finally starting to have a significant impact on Chicago area home prices as we would expect. This morning’s release of the August S&P CoreLogic Case Shiller Home Price Index for the nation and 20 metro areas has the Case Shiller Chicago home price index up 4.1% over last year, which is another 2 year record and the 6th month in a row where this number has risen. This is for single family homes and you can see the blue long term trend line in the graph below. The green line is for condos, which showed a 3.9% year over year gain, the highest in 8 months.
This also means that we have gone 46 months in a row with year over year gains in home prices after that dreadful housing bust.
The sad news is still the fact that we are in 4th place from the bottom of 20 metro areas in terms of year over year gains. It makes sense that most of those other cities are ahead of us with their nicer weather and/ or more vibrant economies but Detroit? Give me a break! Detroit home prices were up 5.7% from last year. However, at least we have company now in our 4th from the bottom rank: Boston was also up 4.1% from last year.
 Case Shiller Chicago Home Price Index By Month
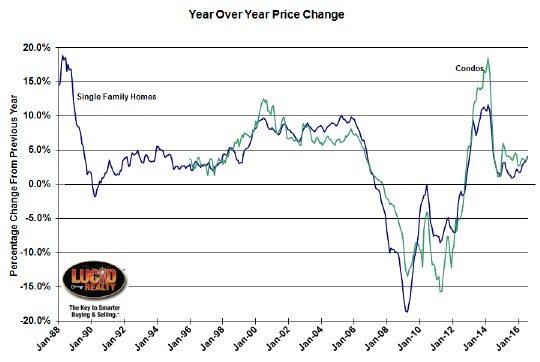
The graph below shows the long term history of both the single family and condo index values – single family going back to 1987 – along with a trend line based on the pre-bubble period. The August single family index was up 0.5% from July while the condo index was essentially flat. When you factor in what is supposed to happen at this time of year Chicago area single family home prices actually retreated slightly.
Two of the most prominent features of this graph is where we are now relative to the bubble peak and relative to the bottom of the housing market. Single family home prices are still down 18.0% from the peak while condo prices are 12.4% below the peak. However, the national index is basically back to peak levels (OK, it’s actually 0.1% below it) at this point in time which just goes to show you how badly we are lagging the rest of the nation.
From the bottom of the market single family home prices have recovered 34.6% and condo prices have recovered by 44.9% which compares to a 37.6% recovery at the national level. Clearly the Chicago market dropped more than the nation as a whole during that whole housing crash thing, which is one of the reasons we still have so much further to go.
Single family home prices in Chicago are still below their level during the entire period from March 2004 – December 2008 and condo prices are below their level from July 2004 through January 2009. And we are still lagging that trendline – now by 22.3%.
 It’s important to recognize that all these statistics that I just reviewed are for the entire metro area. Individual results can vary greatly as I pointed out in this recent post: Where Chicago Area Home Prices Have Risen And Fallen The Most
This morning’s news release also made some inane comparison between the returns of the stock market vs. the returns of the housing market in the last few years. It’s a meaningless comparison because they are two totally different asset classes so I will not be repeating it here.
#ChicagoHomePrices #CaseShiller
Gary Lucido is the President of Lucid Realty, the Chicago area’s full service discount real estate brokerage. If you want to keep up to date on the Chicago real estate market, get an insider’s view of the seamy underbelly of the real estate industry, or you just think he’s the next Kurt Vonnegut you can Subscribe to Getting Real by Email using the form below. Please be sure to verify your email address when you receive the verification notice.