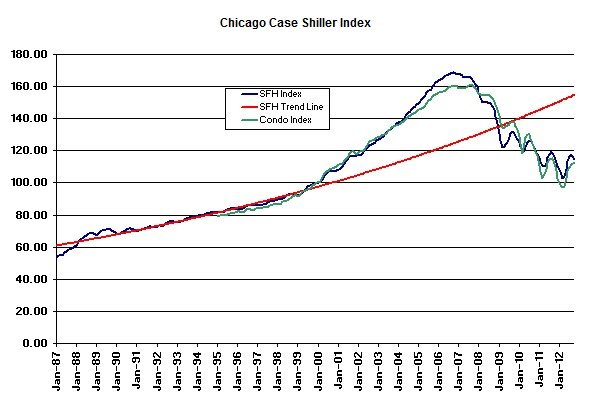
S&P just released the October Case Shiller home price index for Chicago and the rest of the nation and, as is normal at this time of the year, prices slipped – but not as much as usually happens. Single family home prices dropped 1.5% in the last month to the level last seen in June/ July 2001. Prices have now fallen a total of 31.9% from the bubble peak in September 2006 but they are still up 11.8% from the March low. You can see the long term trend in the graph below and prices are 25.8% below that red trend line. Sure looks like an overshoot to me.
Meanwhile, condo prices fell only 0.2% in the last month to the level last seen in March/April 2001. That’s a 30.4% drop from the peak but a 15.1% increase from the March low.
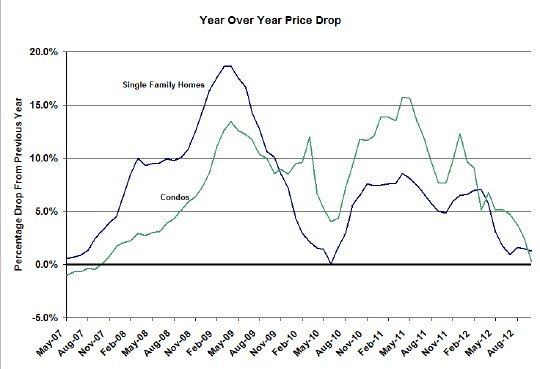
Every month lately I/ we anxiously await the release of the Case Shiller home price index for Chicago to see if prices finally rise over the previous year. It hasn’t happened in more than 5 years and if it finally does some (including me) would see it as compelling evidence that home prices have finally bottomed. For the country as a whole prices turned the corner back in June but Chicago has been lagging the rest of the country. However, we’re getting awfully close now to our first year over year increase since the bubble burst. Check out the graph below and you’ll see that both single family home prices and condominium prices are reaching record low year over year price drops. For October single family home prices are down 1.3% from the previous year but condo prices are down only 0.3% – that is a record low for condo prices.
In commenting on the national picture David Blitzer, Chairman of the Index Committee at S&P Dow Jones Indices, highlighted Chicago’s weak performance:
Among all 20 cities, Chicago was the weakest with prices dropping 1.5%, followed by Boston where prices fell 1.4%….Annual rates of change in home prices are a better indicator of the performance of the housing market than the month-over-month changes because home prices tend to be lower in fall and winter than in spring and summer. Both the 10- and 20-City Composites and 19 of 20 cities recorded higher annual returns in October 2012 than in September.
Looking over this report, and considering other data on housing starts and sales, it is clear that the housing recovery is gathering strength. Higher year-over-year price gains plus strong performances in the southwest and California, regions that suffered during the housing bust, confirm that housing is now contributing to the economy. Last week’s final revision to third quarter GDP growth showed that housing represented 10% of the growth while accounting for less than 3% of GDP.

